Back to Obsessing About the Fed; Range Trading on the 10 Year Treasury; Market Out Of Gas For Now
You know Wall Street couldn’t go more than a few weeks without obsessing about the Fed and if there is going to be a rate cut this year or not. I swear to God……
The immediate cause is today’s April New Home Sales Report from The Commerce Department that, at least on the surface, appears strong. New homes sales were up 16.2% from March – which was revised down about 1.6%.
But it’s worth mentioning that March was down 1.4% from February which was in turn down 3.8% from January which was in turn down 12.7% from December.
On top of that, the median price of a new home was down 9.8% from March to $229,100 (from $254,000).
*****
Anyways, the market was up like 60 points off the bat when the report was released at 10am EST.
Problem is yields on the 10 year treasury took off as well, up about 5 basis points to just below 4.9% within an hour as well. The idea here is that if housing is starting to stabilize the Fed won’t need to cut rates. Yada yada yada…..
Then, as the stock market started paying attention to rising interest rates and started considering the same thing, i.e. the Fed won’t cut, it started to tank.
Bottom line, just like the retail sales report from 2 weeks ago, this April New Home Sales Report doesn’t mean anything. It’s off a low base and the big drop in prices shows capitulation from homebuilders. This doesn’t mean housing is bouncing back just like the retail sales report didn’t mean the consumer was reigning in their spending.
*****
As far as the Fed goes I don’t think this report has any impact on what they are going to do: The Fed Is On Hold!!!
If that’s right, then the 10 year doesn’t have that much higher to go. It hasn’t been above 5% since the Fed paused at 5.25% last August and its local high is 4.9% from late January of this year – where it found resistance today.
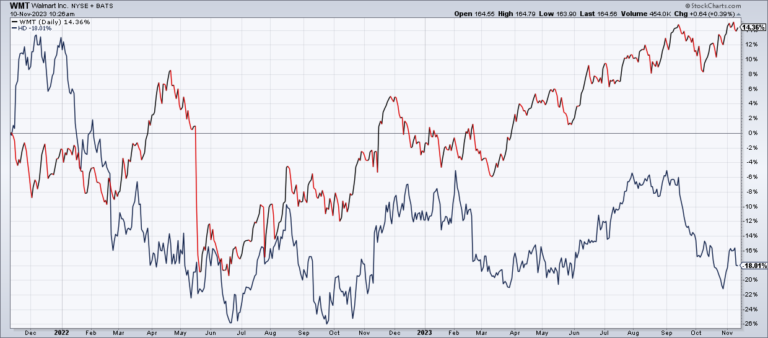
We’re range trading on the 10 year. In fact, it appears we’re going through just the same thing we did only a few months ago (10 Year Treasury Chart, 1 Year).
Back in early December the 10 year touched a local low around 4.4% in expectation of an imminent rate cut. As incoming data suggested that the Fed might be on hold for a bit longer it seemed that Treasuries had overdone it and yields started to go back up – reaching a peak near 4.9% only 2 months later in late January.
Over the next 6 weeks or, with the emergence of the subprime melt down and the big sell-off on Feb 27 rates started to go back down in expectation that a rate cut was again more likely touching 4.5% in the middle of March.
And now, for the last 2 months, since the “additional firming” vs. “future policy adjustments” brouhaha of March 21, rates have headed back up finding resistance today at 4.9%.
If economic data starts to come in weaker than expected again, as is likely given the friggin’ state of the economy, people will start looking for a rate cut again and yields will fall.
*****
At the same time, this week’s trading is worth paying attention to. For the 4th day in a row, the market was up big early and finished down. This is in big contrast to the pattern in recent weeks when the market would sometimes get off to a bad start but finish strong.
To me, this signals that the market is out of gas for now. There don’t seem to be any catalysts to push it higher and it might be time for some profit taking and consolidation – at least for a day or two.
Top Gun closed out a long trade on the S&P 500 ETF (SPY) yesterday afternoon after 13 days.
With Memorial Day Weekend coming up, we could see more profit taking, and a nice short term buying opportunity, tomorrow.
UPDATE (Fri 5/25, 10:00am): David Gaffen of the WSJ’s MarketBeat blog has linked to this post this morning.