A Divergence Between the QQQ and the NASDAQ, Bitcoin < $50k, T and SNAP Earnings: A Tale of Two Different Kinds of Stocks
Note: To sign up to be alerted when the morning blog is posted to my website, enter your name and email in the box in the right hand corner titled “New Post Announcements”. That will add you to my AWeber list. Each email from AWeber has a link at the bottom to “Unsubscribe” making it easy to do so should you no longer wish to receive the emails.
Yesterday morning, Andrew Thrasher put up an interesting tweet of the divergence between the NASDAQ-100 and the NASDAQ in the number of components above their 50 DMAs. While 80% of NASDAQ-100 components were above their 50 DMA, only 38% of the NASDAQ’s components were. Thrasher points out that that spread has never been wider in over 30 years.
What does it mean? The NASDAQ-100 is the 100 largest stocks traded on the NASDAQ. In other words, while the largest stocks on the NASDAQ remain strong, the majority of smaller stocks on it are rolling over.
This dovetails with Tuesday morning’s observation that Small and Micro Cap stocks were not confirming the new highs in the Large Cap S&P 500. Again: Large stocks are holding up while the majority of smaller stocks are rolling over.
Combining it all, the major indexes are being held up by the largest stocks while beneath the surface the majority of smaller stocks are rolling over.
This makes the potential failed breakout in the QQQ that I pointed out on Wednesday all the more important. If the largest stocks are the ones holding up the market and the QQQ represents the 100 largest stocks on the NASDAQ (the NASDAQ-100) and Tech (XLK) 27.18% of the S&P 500, then the largest tech stocks are the ones primarily holding this market together. A failure here, therefore, would almost certainly cause the S&P and NASDAQ to roll over.
So where do we stand on this potential failed breakout in the QQQ? The February 12 Closing High for the QQQ was $336.45 while we closed yesterday at $335.20 – the first close notably below the February 12 high since April 8. As I wrote on Wednesday morning, keep an eye on this as it is probably the most important chart in the market right now.
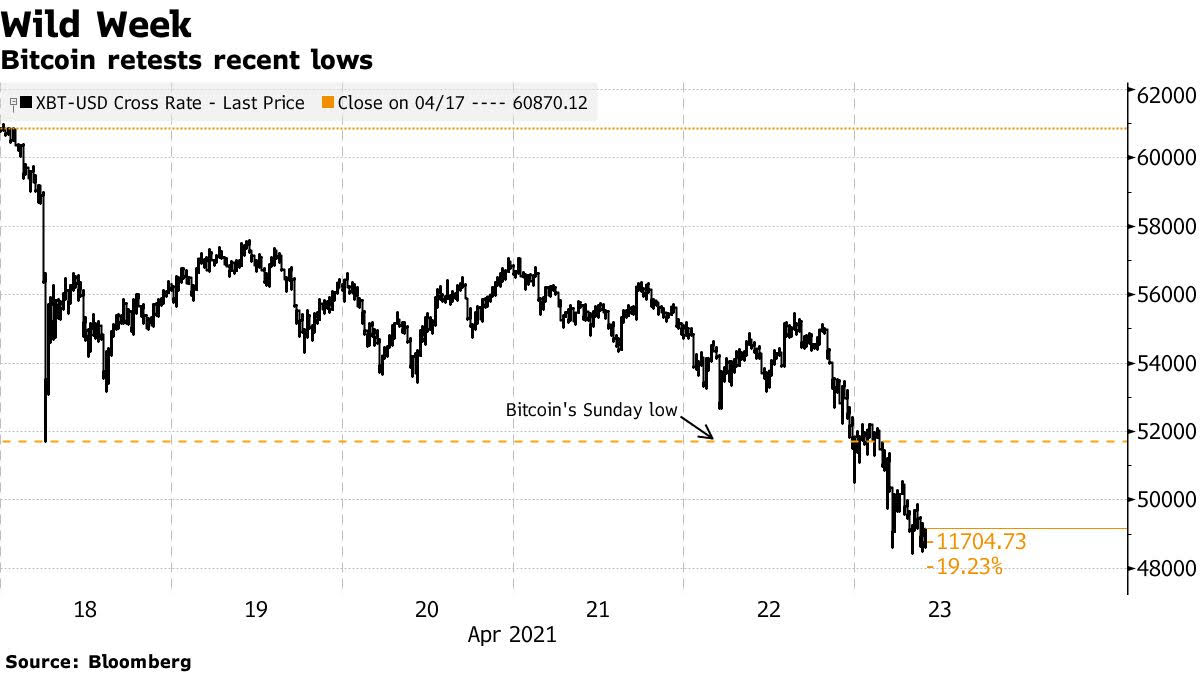
In another sign of flagging risk appetite, Bitcoin has rolled over hard this week. After almost hitting $65k last Tuesday, Bitcoin is currently trading around $48k (as of 3am PST) – a decline of 26% in just over a week.

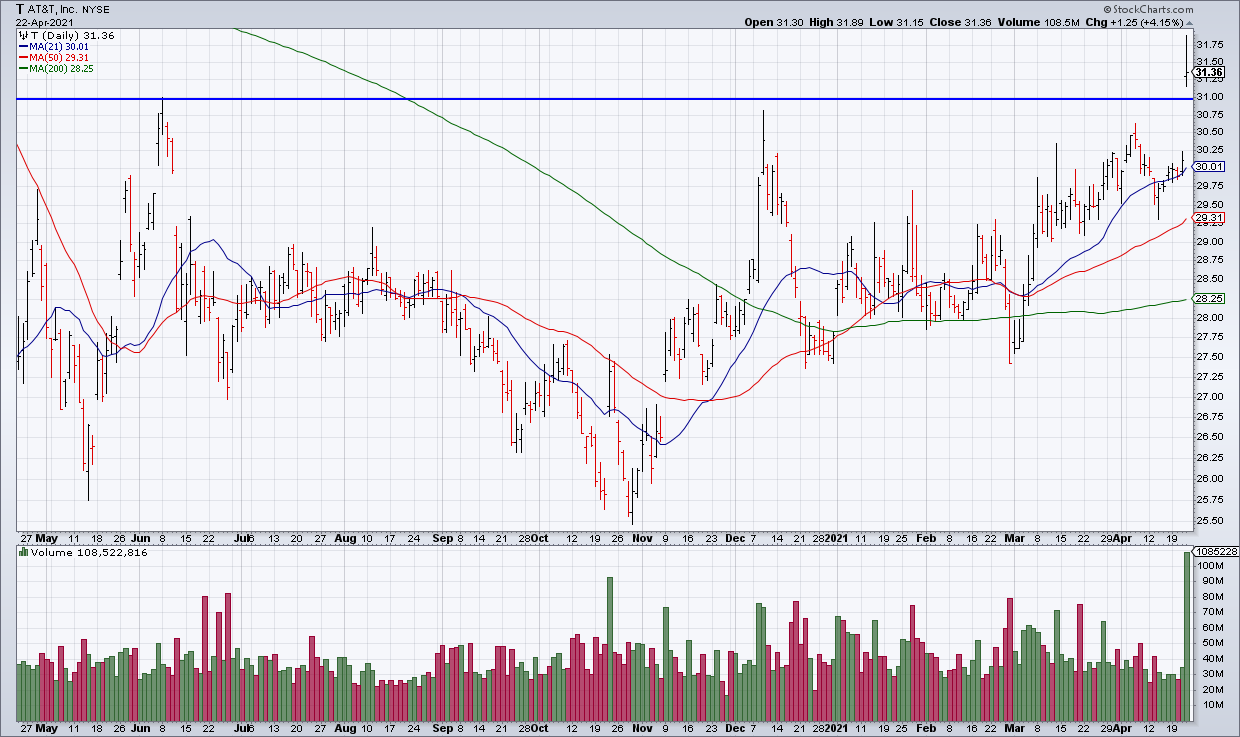
The two most important stocks to report earnings on Thursday were AT & T (T, Market Cap $225 Billion) and Snapchat (SNAP, Market Cap $86 Billion). T reported Revenue +2.7% and Adjusted Diluted EPS +2.4%. While hardly exciting, these were very good numbers for a business that had been reporting year over year declines for the last bunch of quarters. As you can see in the chart above, the stock was +4.15% on the news breaking out to new 52-week highs. With a cheap valuation, inelastic demand for cell phone service and a 6.63% dividend, T is not sexy but it’s working. (Top Gun is long T).

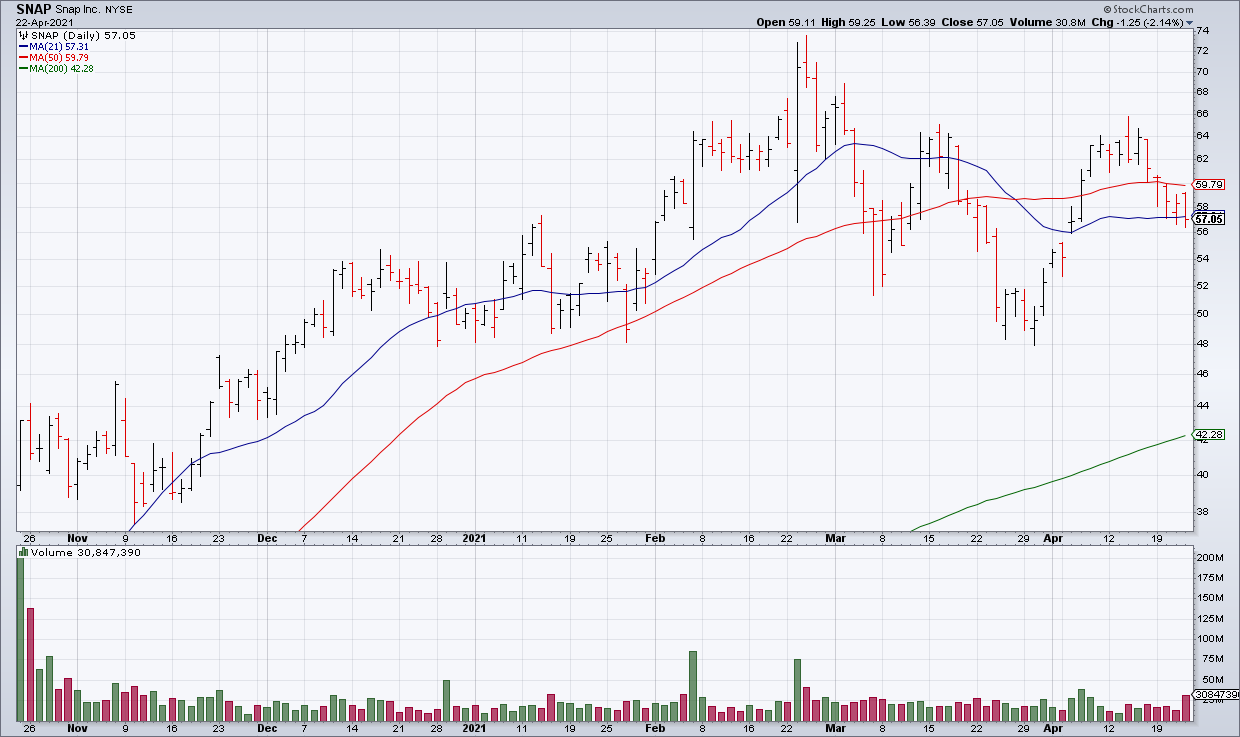
SNAP is an entirely different animal at a very different stage of its growth cycle. Daily Active Users (DAUs) were +22% and Revenue +66% while it broke even on a Non-GAAP basis. Like NFLX, SNAP trades primarily on DAU growth as investors assume that as long as that is strong, earnings to justify current valuation will materialize in the future. SNAP is currently up ~6% in the premarket (as of 3am PST).
There is nothing wrong with either kind of stock. Different kinds of investors tend to gravitate to one or the other. Value investors prefer T while momentum investors prefer SNAP. My personal preference is for a steadier, known quantity like T. However, stocks like SNAP work better when risk appetite is raging as it has been for the last year plus. However, as I pointed out on Tuesday morning, defensive stocks are where the value is in this market, they are breaking out now and therefore I think this is the place to be at the moment.