IWM 30% Above 200 DMA, Magazine Cover Indicator, Strategists Average 2021 S&P Target: 4,035, $ Approaching Long Term Support, Watch 3,633 Today
Note: To sign up to be alerted when the morning email is posted to my website, enter your name and email in the box in the right hand corner titled “New Post Announcements”. That will add you to my AWeber list. Each email from AWeber has a link at the bottom to “Unsubscribe” making it easy to do so should you no longer wish to receive the emails.
Arthur Hill CMT put up a great chart earlier today (Monday) on Twitter showing the IWM 30% above its 200 DMA – the highest on record since the ETF started trading in 2000 (Chart Sources: Arthur Hill CMT Twitter).
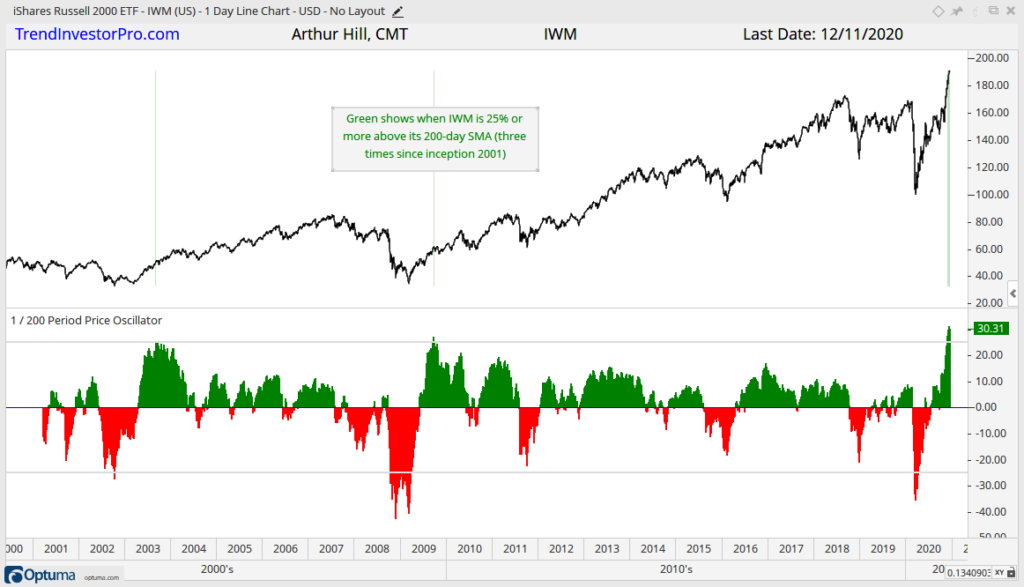
When an individual stock is 30% above its 200 DMA, it’s considered extended. For an entire index of 2000 stocks to be that far above its 200 DMA just shows how extreme the price action has been of late.
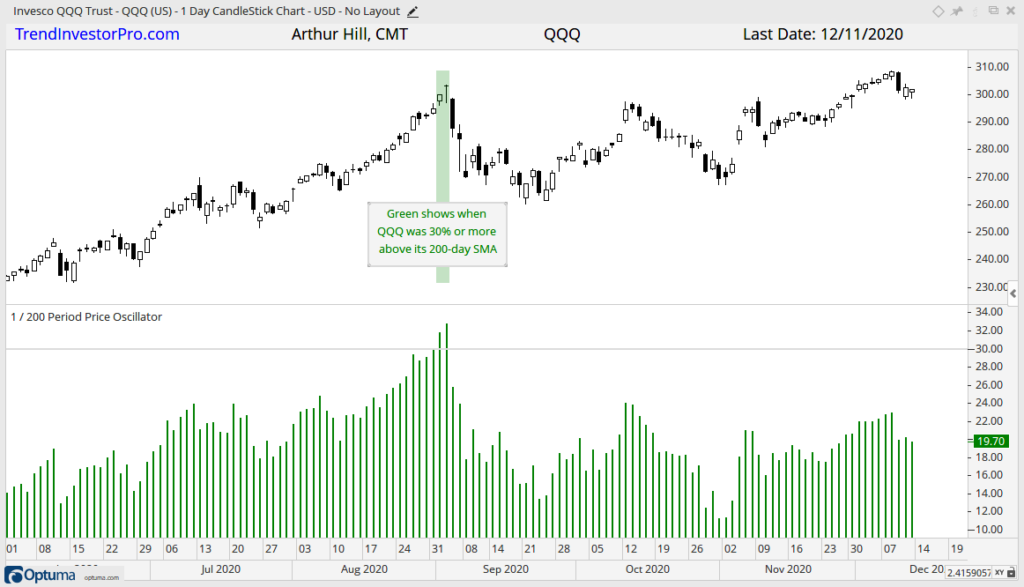
For two days earlier this year (9/1 & 9/2), the QQQ got more than 30% above its 200 DMA. Sept 2 marked a top that it is still struggling to breakthrough.
I wanted to buy the IWM, among others, for a year end trade but I won’t buy an index ETF that is this extended. In fact, I believe that the market being as extended as it is trumps normally bullish seasonality i.e. the Santa Claus rally. Santa may not be coming this year.
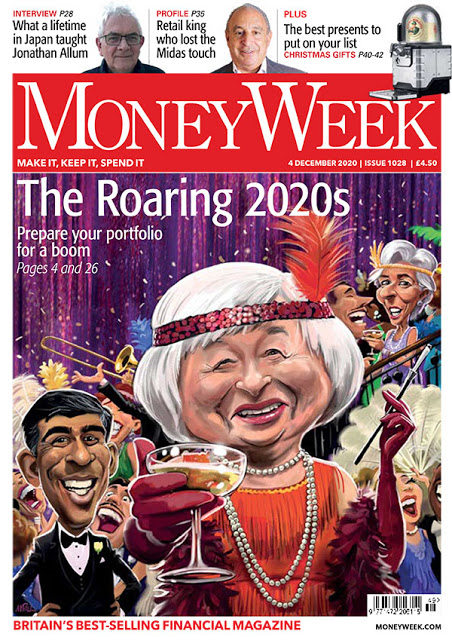
Corresponding to this extreme price action is extreme sentiment. I’ve analyzed this primarily via the put/call ratio, which is my favorite because it shows what investors are doing with real money. Nevertheless, a classic Wall Street indicator of sentiment is the Magazine Cover Indicator. Well, Ryan Detrick of LPL made a nice catch yesterday on Twitter when he contrasted the Economist’s cover in March 2020 versus Money Week’s earlier this month (Dec 2020) (Magazine Cover Images Source: Ryan Detrick Twitter, Monday December 14, 5:34am PST)

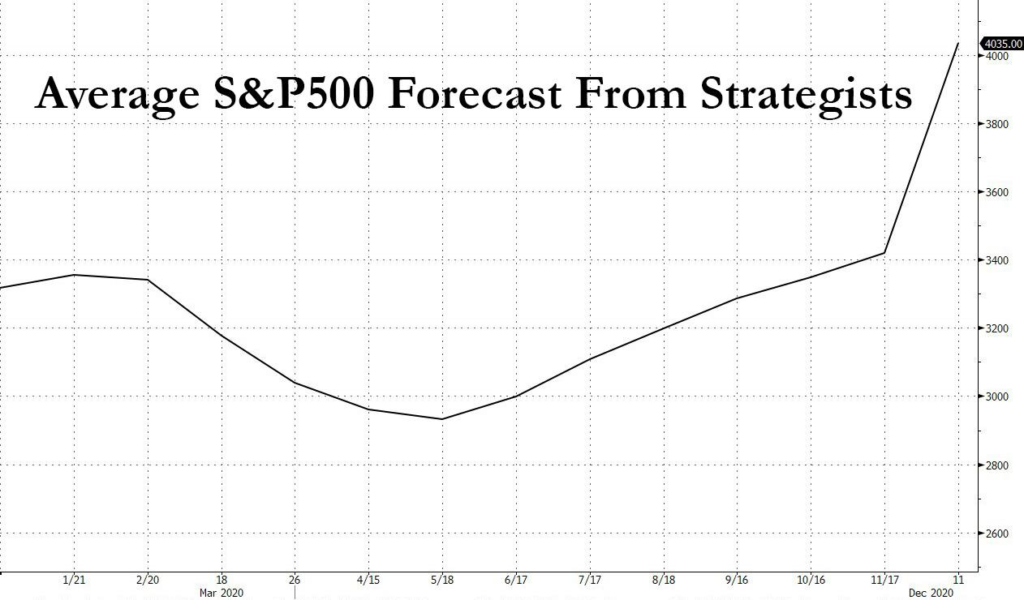
Continuing with sentiment, Wall Street strategists are almost unanimously bullish on 2021 with a 4,035 average price target, according to Lance Roberts (Chart Source: Lance Roberts Stocktwits, Monday December 14, 1:29pm PST). Roberts quoted Bob Farrell in his tweet: “When all experts agree, something else tends to happen.”
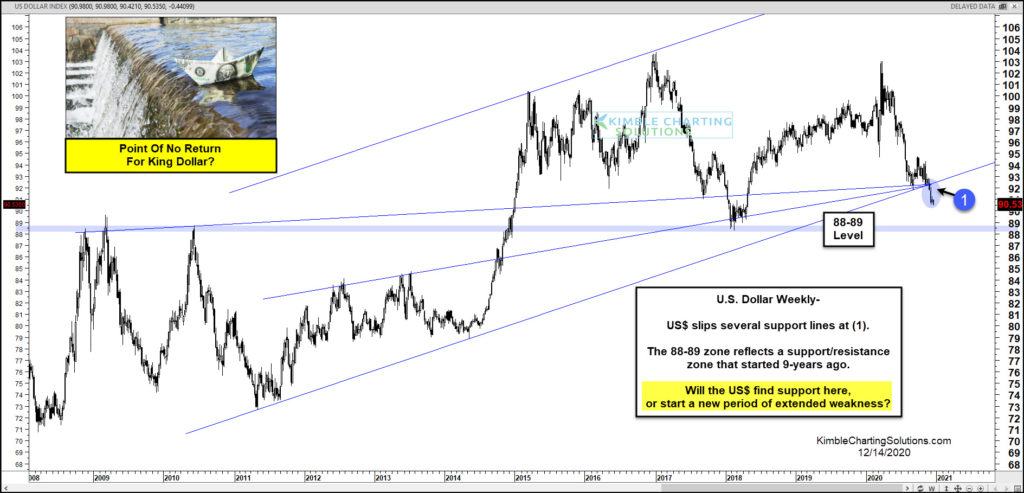
Turning to the $, support at 92 failed and now only long term support in the 88-89 range exists (Chart Source: Chris Kimble Blog). I’ve discussed the consequences of the $ crash – rising asset prices, consumer price inflation, rising interest rates – many other times in morning blogs.
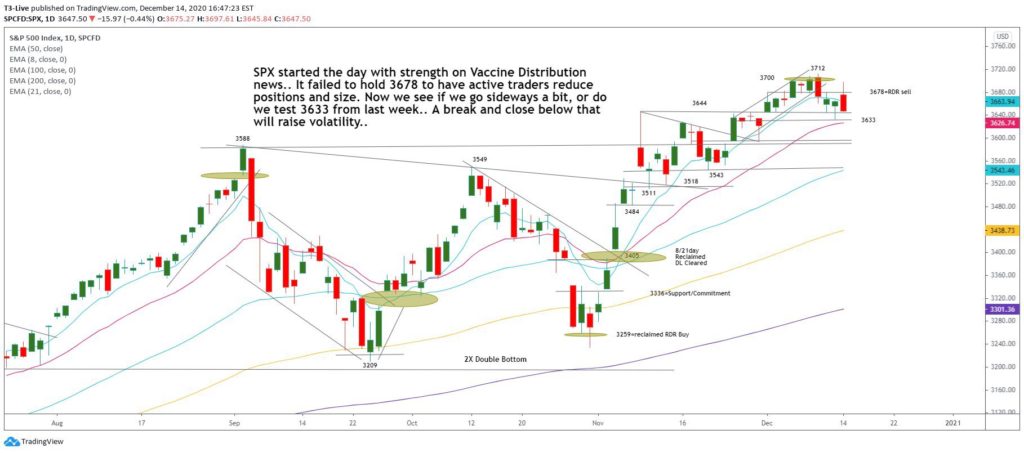
Getting more micro, day trading wizard Scott Redler says to watch and see if 3,633 short term support holds today (Chart Source: Scott Redler Twitter, Monday December 14, 1:52pm). “A break and close below that will raise volatility,” Redler annotated the chart.