Recapping Wednesday, Tops Are A Process, The Levels That Must Hold (QQQ $300)
Note: To sign up to be alerted when the morning blog is posted to my website, enter your name and email in the box in the right hand corner titled “New Post Announcements”. That will add you to my AWeber list. Each email from AWeber has a link at the bottom to “Unsubscribe” making it easy to do so should you no longer wish to receive the emails.
On Wednesday, the S&P was -0.55%, the NASDAQ -2.01% and the Russell -2.35%. The first part of the day was a battle with bulls and bears vying for control. Around 8:30am PST, the bears took control sending the indexes down for the remaining four and a half hours of the session.

NYSE + NASDAQ Advancers to Decliners was 2,429 to 5,051. In other words, about two stocks fell yesterday for each that rose. There were 136 new 52 week highs versus 425 new 52 week lows. New 52 weeks lows stood out to me, representing 5.5% of all securities traded on the NYSE + NASDAQ.
Now I want explain that tops are a process, as Paul Desmond brilliantly demonstrated in his Lowry’s white paper “An Exploration of the Nature of Bull Market Tops” (available for free on Lowry’s website). Bottoms are an event; I clearly remember what the last one on March 9, 2009 felt like. All stocks tend to bottom at once simultaneously. However, tops take time to play out with one stock or group of stocks topping out after another until by the time the leading index has peaked most individual stocks and groups of stocks have already rolled over. And that’s exactly what we’ve seen this time around.
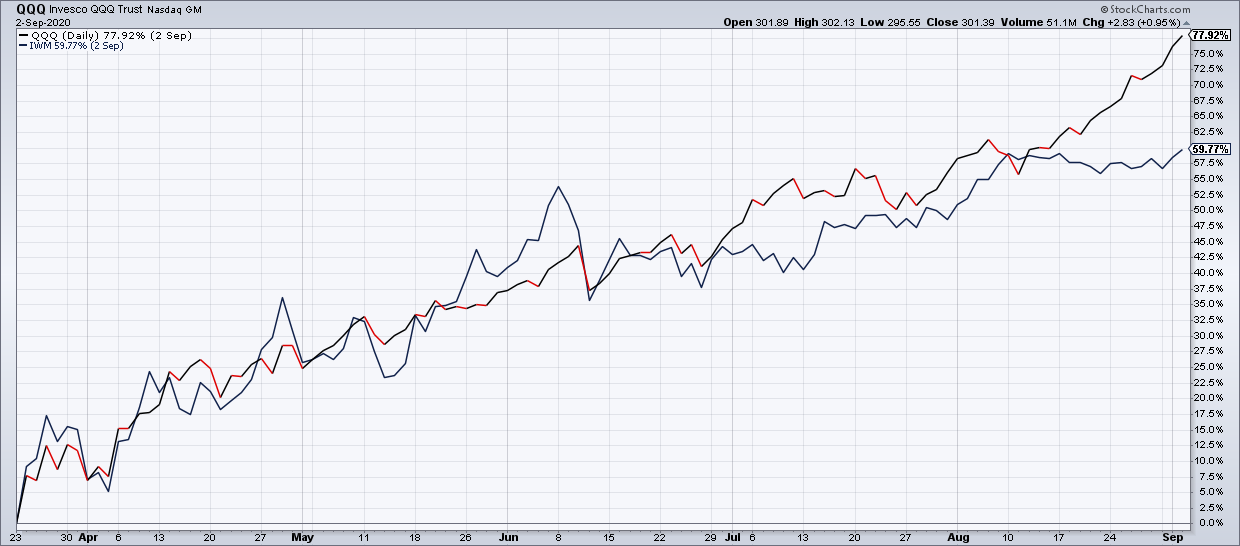
I think it actually started on September 2, 2020 when the QQQ gave up leadership to the IWM. Mega Cap tech had been leading us higher off the March 2020 lows and I clearly remember thinking and reading about how thin the market was. Check out this chart of QQQ versus IWM from March 24, 2020 through September 2, 2020.
After a two month correction, however, IWM took over leadership from QQQ, especially picking up steam in the wake of Pfizer’s COVID vaccine announcement on Monday, November 9. This can be seen in a chart from November 2, 2020 to March 15, 2021 – when IWM made its most recent closing high.
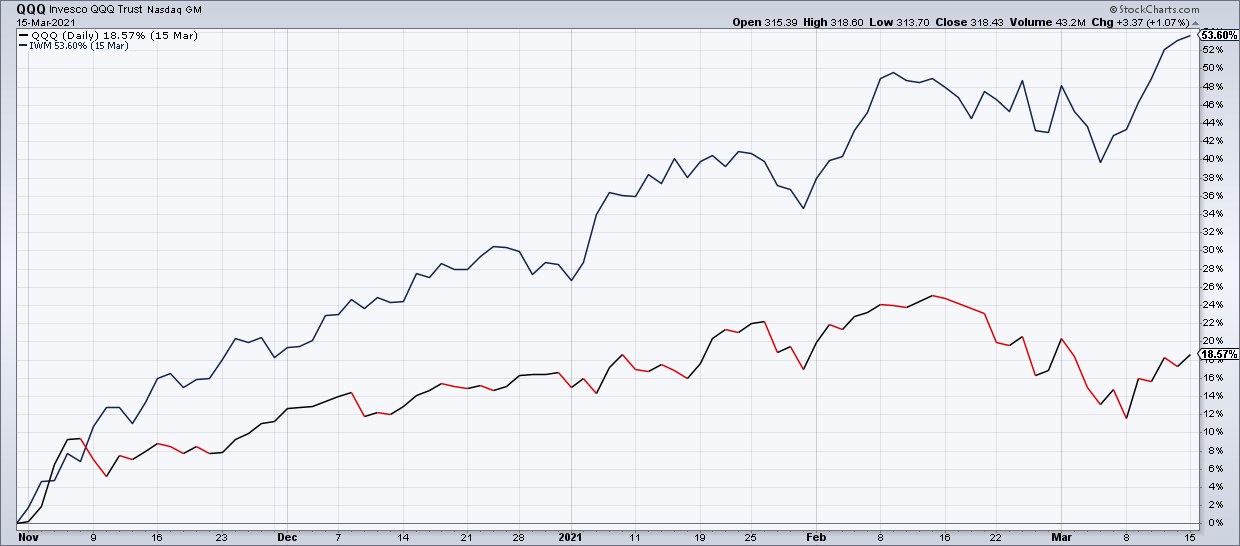
As you can see, IWM massively outperformed QQQ over this period. Even though QQQ did not top out on an absolute basis on September 2, 2020 I believe that its giving up leadership and relative underperformance since then was the first event in the topping process.
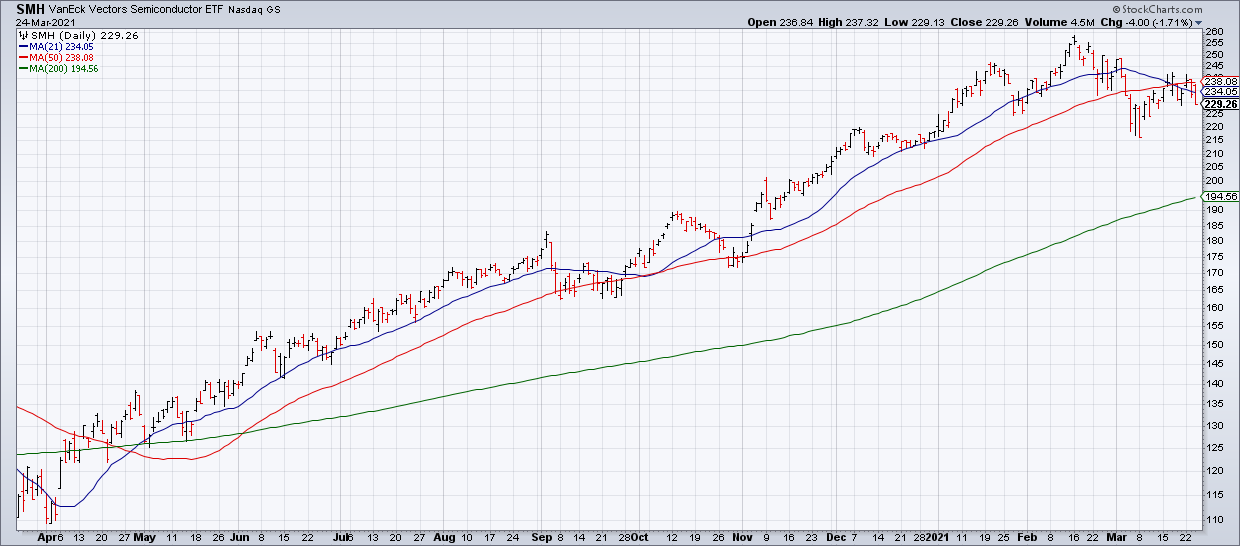
The next event in the topping process took place on Friday, February 12 2021 when Cathie Wood’s Ark Innovation ETF (ARKK), the leading ETF since the March 23, 2020 lows, appears to have topped along with QQQ on an absolute basis this time. The leading semiconductor ETF (SMH) appears to have topped the next session (Tuesday, February 16, 2021).
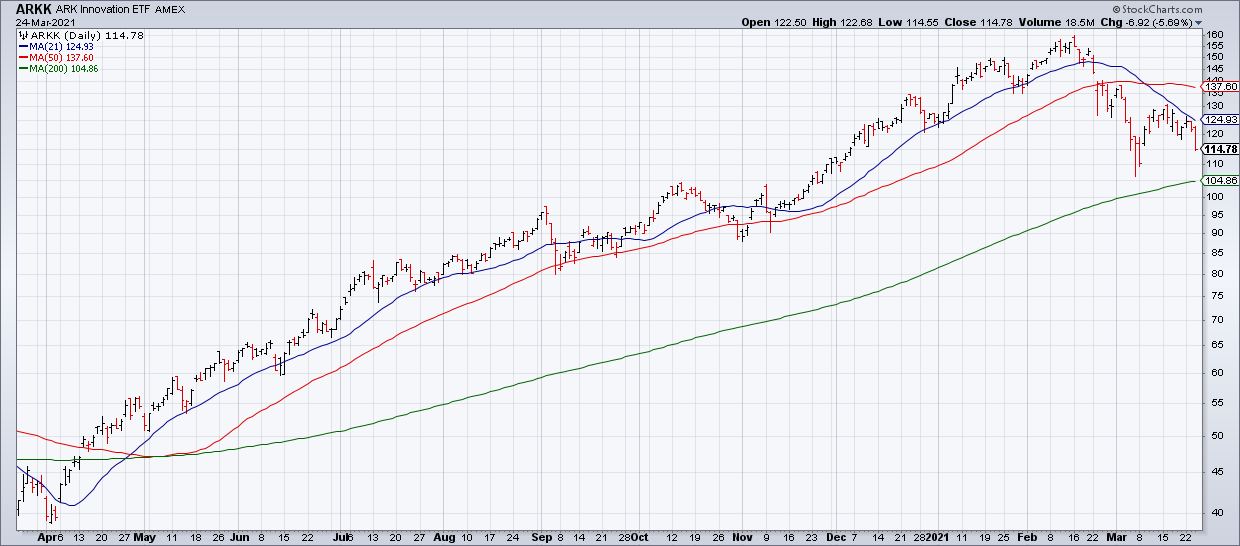
By early March I was convinced there was enough evidence we were in a bear market that I went short ARKK (15%), QQQ (7%), SMH (7%) and IWM (7%) on Thursday March 11.
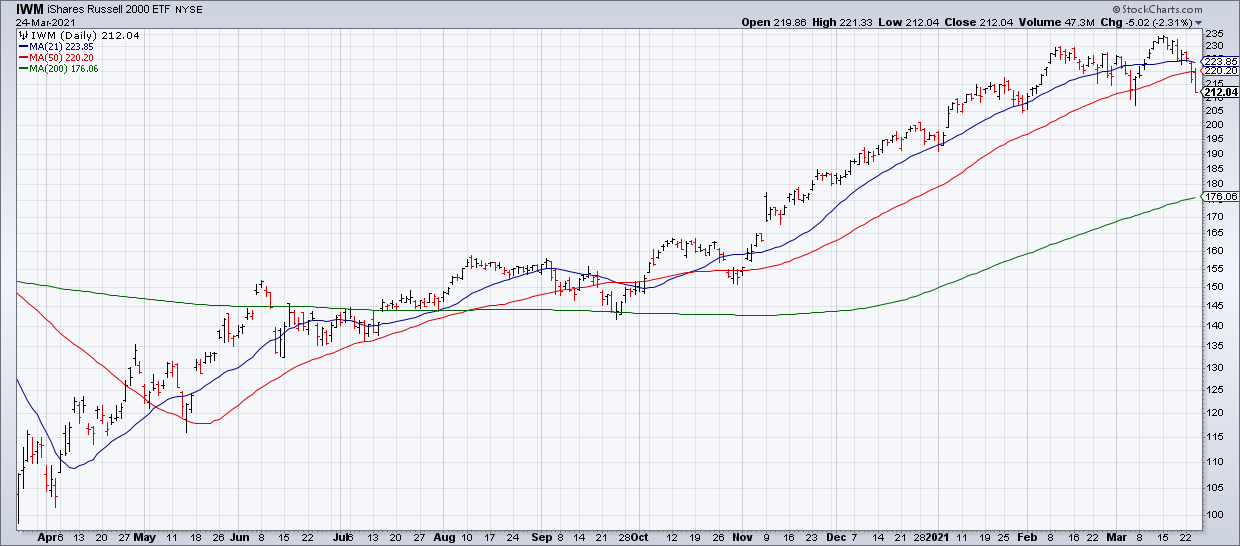
At that point, the only thing propping up the market, which had been led by Tech since March 9, 2009 and especially since March 24, 2020, was the Russell 2000 index of small caps which continued to rip higher. However, it now appears to have peaked on Monday, March 15 pulling out the last leg supporting the bull market besides for a few reopen sectors like the Financials and Industrials.
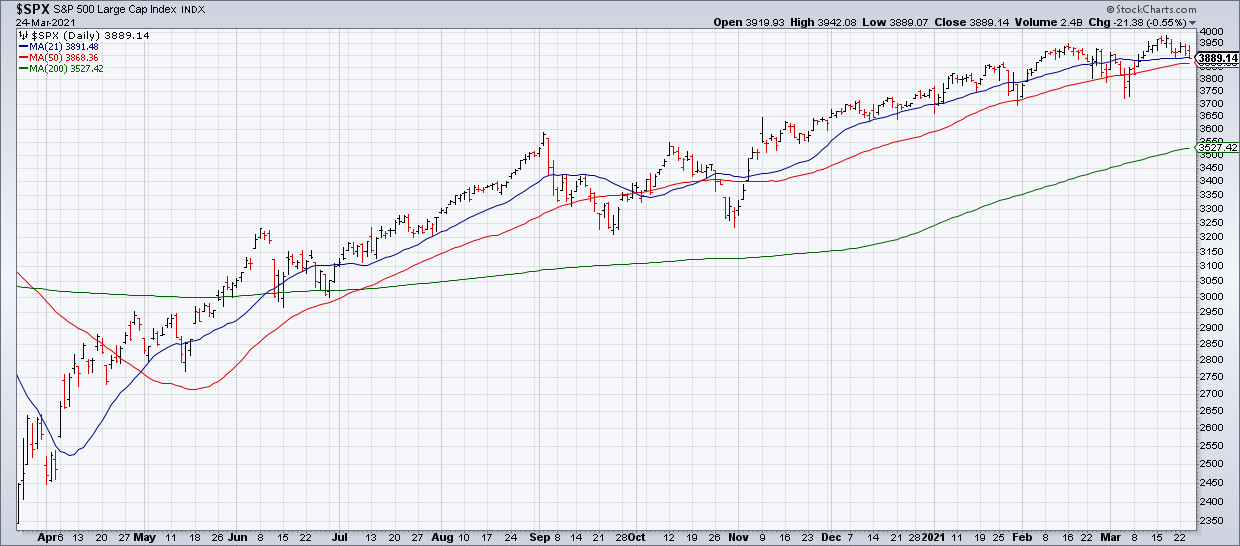
While the S&P has not yet broken down technically, my guess is that is has now also topped on Wednesday, March 17 marking the formal end to the bull market that began twelve years ago.
In other words, the topping process is playing out exactly the same way it has during the previous fifteen bull market tops reviewed by Desmond in “An Exploration of the Nature of Bull Market Tops”:
The primary conclusion to be drawn from these fifteen cases is that the vast majority of stocks reached their bull market highs well before the peak in the DJIA… The amazing similarity of the statistics in these fifteen cases suggests a pattern of deterioration at major market tops… In searching for a way to describe this phenomenon of market deterioration – the gradual process of hundreds of individual stocks rolling over into their own bear markets, one by one, over a period of many months – the picture of a feather emerged.
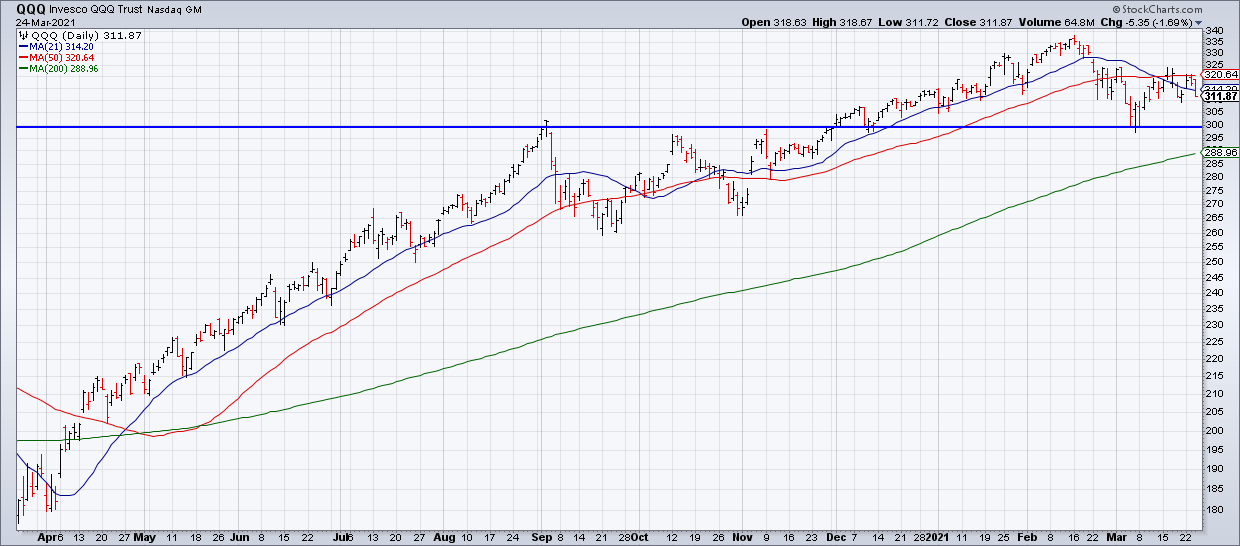
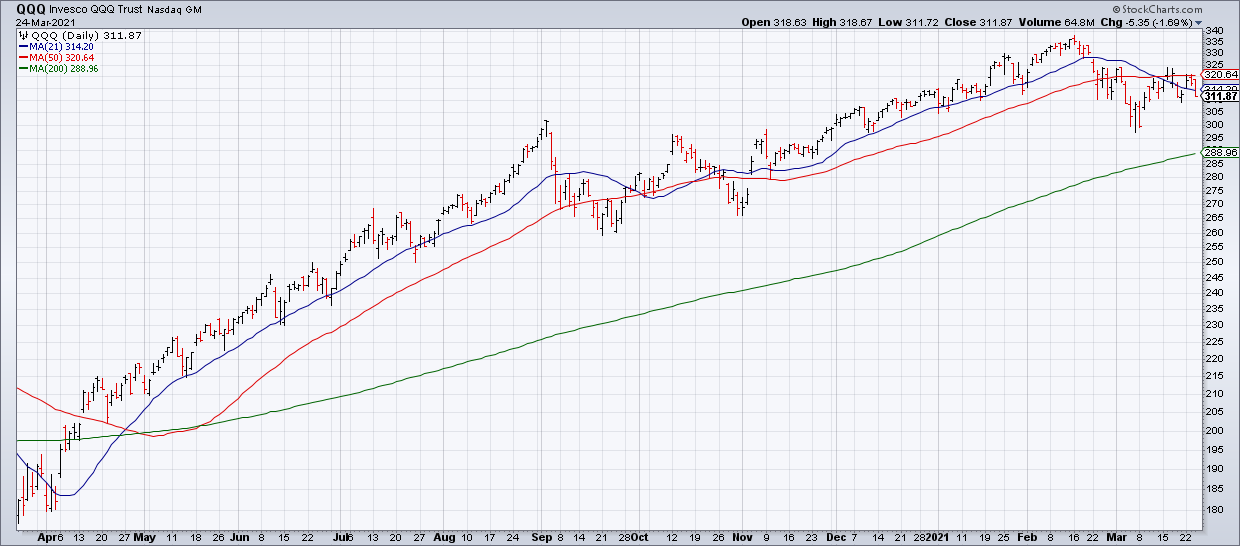
However, I am jumping the gun slightly. What would really add weight to this conclusion for me would be closes below their Monday March 8 lows for the NASDAQ, QQQ, ARKK and SMH (the IWM actually closed yesterday ($212.04) below its March 4 correction closing low ($213.19)).
If I had to pick one level I want to see taken out it would be QQQ $300 for everything it represents. The QQQ is led by the biggest stocks in the market such as Apple (AAPL), Amazon (AMZN), Microsoft (MSFT), Google (GOOG, GOOGL), Tesla (TSLA) and Facebook (FB). These stocks make up such a big proportion of the market cap of the major indexes that it will be extremely hard, if not impossible, for them to advance with QQQ as a headwind. Technically, $300 represents the September 2, 2020 high as well as the recent correction low. A breakdown there would negate all its gains over the last seven months in addition to making new correction lows.