NOTE: Every week I write a Client Note for my clients. For a limited time, I am allowing non-clients to sign up and receive the Client Note. You can sign up at the top right hand corner of the website. I will also be posting the notes on my blog with a 24-48 hour delay from time to time. Here is this week’s.
Originally sent Monday, October 25, 2pm PST.
*****
“It’s a one-way street; clients are rotating into equities,” a top trader said. Why?
Investors expect Republicans to win mid-term elections on Nov. 2 and to take control of Congress, and the wheels of the Wall Street-hating, taxing Democratic bandwagon to grind to a halt. An extension of the Bush tax cuts would be good for stock prices, too.
The Nov. 3 meeting of the Federal Reserve’s interest-rate-setting committee is another key event. The Fed is expected to release details of its plans to stimulate the economy. A big, bold QE2, short-hand for the second round of quantitative easing, could push markets higher, especially if the Fed spends big money buying Treasuries.
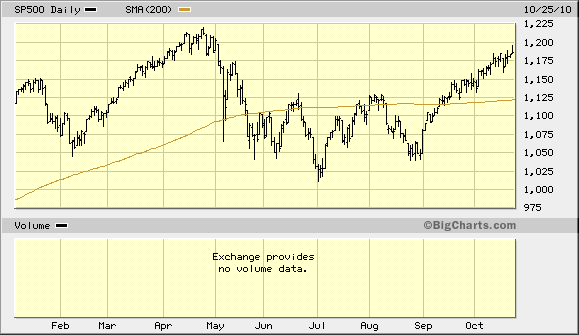
In the eight weeks starting Wednesday September 1 through today (Monday October 26), the S&P 500 rallied 137 points or 13% – from 1049 to 1186.
The expectation of two events has driven the move. For one, investors began anticipating big Republican gains in the midterm elections on November 2. This could obstruct the Democrat’s agenda and potentially extend the Bush tax cuts.
Having mentioned the primary causes of the recent rally, now is a good time to step back and put the move in context. In early February, I made the analogy to 2004 and suggested that 2010 could be a similar range bound stock market (
“Top Gun FP Client Note: Deja Vu All Over Again”, February 9, 2010, Top Gun Financial). While I was a little early in calling the end of the “junk” phase of the rally, that has turned out to be a pretty good forecast.
In January, the S&P made an intermediate high around 1150 before declining into an intermediate low around 1050 in early February. From there, the market resumed its upward trajectory almost reaching 1220 in late April. After that, there was the European sovereign debt crisis as well as the May 6 flash crash resulting in a nasty selloff which got as low as 1010 in early July. In July, the S&P rallied a little more than 100 points and in August it gave back most of those gains.
Overall, then, the S&P has traded in a range of about 1000-1200 over the course of the year. It has closed above 1200 just nine times this year – all between April 14 and May 3. Put in this context, the current rally has taken stocks into the top of the range.
The question that now presents itself is: Can the market breakout through the top of the range and resume the bull market that began in March 2009? Or, on the other hand, have Republican gains in the coming midterm election as well as QE2 from the Fed already been discounted into stock prices meaning that the rally has about run its course?
Everything is pointing towards next Tuesday’s election and next Wednesday’s Fed meeting. The market reaction to those two events will tell us what we want to know.
SPECIAL OFFER – FREE INVESTMENT REVIEW: For a limited time I am offering a free investment review. Pick any stock, bond, ETF or mutual fund. I will do a comprehensive fundamental/macro/technical analysis, write a concise analyst report, and consult with you for 30 minutes by phone or in person for free.
Greg Feirman
Founder & CEO
A Registered Investment Advisor
9700 Village Center Dr. #50H
Granite Bay, CA 95746
(916) 224-0113
CALL NOW FOR A FREE INVESTMENT REVIEW!

