Graham Summers Says The Carry Trade Doesn’t Matter – I Think He’s Wrong
In today’s Growth Stock Wire, “The Yen Carry Trade: Not All It’s Cracked Up to Be”, Graham Summers essentially argues that the carry trade is too small to matter:
It’s true that the Bank of Japan has supplied the world with greater liquidity, but not nearly on the level most analysts would like you to believe.
The Japanese Ministry of Finance and the Bank of Japan believe that short term, carry trade related borrowings in the yen come to between $20 billion and $40 billion. That may sound like a ton of money …. but it’s not. It’s about one-fifth Walmart’s market cap.
Even when you add in individual Japanese investors, the total amount of money involved in the carry trade is believed to be around $170 billion. That’s about one tenth of the combined market cap of the S&P 500 [it’s actually about 1/75th the S&P’s combined market cap of around $12.7 trillion – which actually strengthens the point he is making here].
However, this $170 billion is spread out over various indexes, bonds, etc… throughout the entire world. It’s just a drop in the sea of global liquidity.
But everything depends on the actual size of the carry. And nobody really seems to know what it is. Summers puts it at $170 billion here. But The Economist recently put it at around $1 trillion in an article entitled “The cheap yen is dangerous” (subscription required).
Would it make any difference to Summers if The Economist’s number were closer to the truth? In that case, the total value of the carry would be around 1/13th the total market value of the S&P 500 rather than the 1/75th his number implies.
Another analyst who implies that the carry is more significant is the author of the fascinating and surreal The Dollar Crisis, Richard Duncan, who wrote an article a couple of years ago entitled “How Japan financed global reflation”.
It’s hard to just dismiss the following chart which shows the S&P 500 and the $/YEN essentially moving in tandem over the last 3 months.
S&P 500 (black line) and $/Yen (orange line), December 27 2006 – March 26 2007
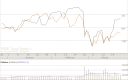
The argument would have to be that it’s the movements in the market that are fundamental – causing the movements in the $/yen. But it’s also plausible to think that there is some, even alot, of causation the other way – especially if the carry is around $1 trillion.