Would You Buy This Chart?
A fun and interesting excercise in technical analysis from The Big Picture.

A fun and interesting excercise in technical analysis from The Big Picture.
We just don’t know how any indicator or assumption will fare since there has been nothing like the current market since at least 1987. Arguably, there has been nothing like it since 1929. – “When Market Analysis Capitulates” (subscription required),…

Take a close looks at the eighteen red dots in the chart above by Jason Goepfert of Sentimentrader: 1987, 1990, 1998, 2008-2009, 2018-2019, 2020. Breadth readings this bad – this many stocks hitting 52-week lows on the NYSE and NASDAQ…
It was a truly monster day on The New York Stock Exchange. 3043 of 3434 issues advanced – a ratio of almost 9 to 1. And up volume of 1.59 billion of a total volume of 1.6475 billion means that…
NOTE: Every week or two I write a Client Note for my clients. For a limited time, I am allowing non-clients to sign up and receive it at the same time as my clients. You can sign up at the top…
(Via BeSpoke Investment Group)
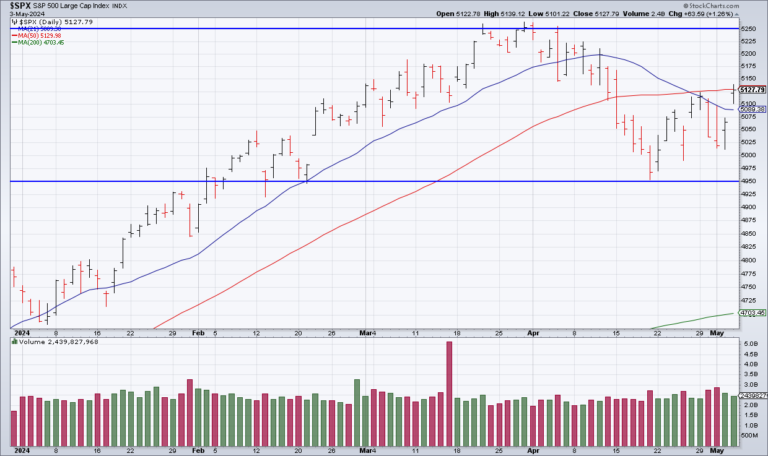
The S&P surged 64 points (1.26%) on Friday to 5,128 – right up to its 50 DMA (5,130). The 50 DMA continues to serve as resistance and the S&P continues to trade in a range (4950 – 5250) defined by…