The Technicals Are Bearish – Watch For The Break Below 1400
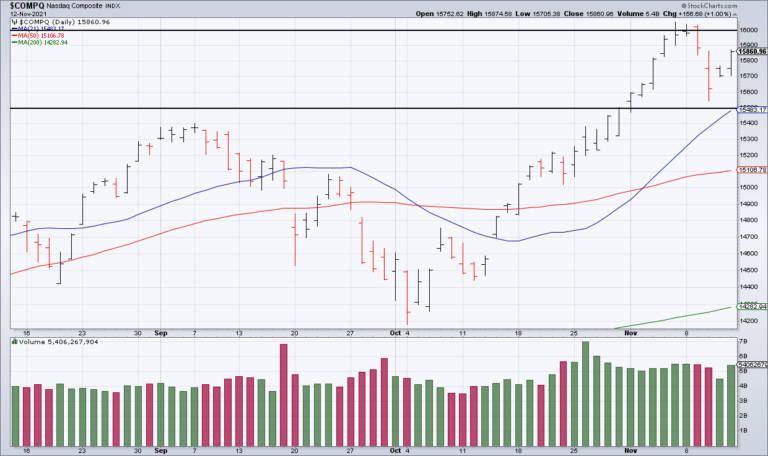
If you look at a chart of the S&P for the last 6 months, the action is really bearish from a technical standpoint (S&P Downtrend Chart).
We had a double top around 1560 (July 19, Oct 9). And now we’ve had two succesively lower highs (Oct 31, Dec 10). And the double bottom (August 15, November 26) around 1400.
It just seems like the market is out of gas and has topped. And if/when it finally does breakthrough 1400 to the downside, I think you’ll see a major sentiment shift as more and more people start to call it a bear market. That should result in some serious selling.
So you want to be out, and short if you’re so inclined, before that happens. I wouldn’t be surprised to see that level breached as 4th quarter earnings get reported in the January/February time frame.