Is The Bottom In?
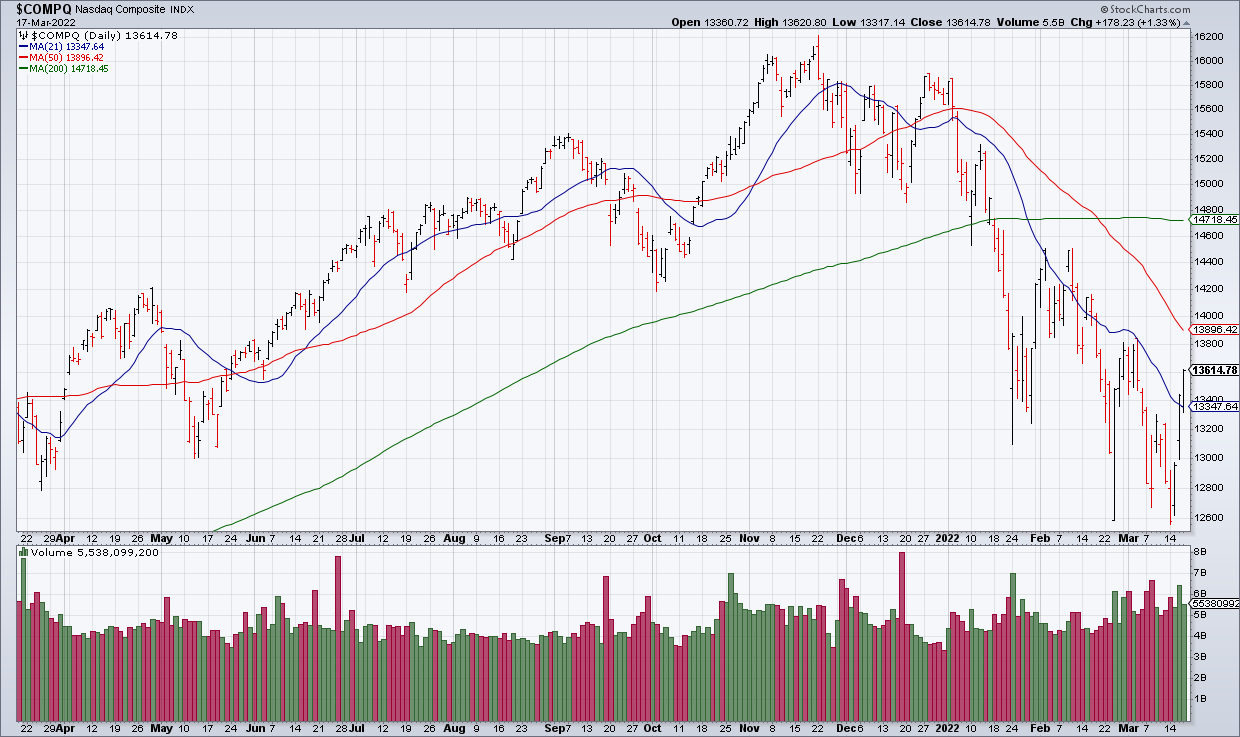
The powerful three day rally from Tuesday through Thursday has generated a lot of excitement and speculation that the bottom may be in. The NASDAQ is up more than 1,000 points (8%) over that span.
Grant Hawkridge tweeted a nice table Thursday showing that when the S&P is up at least 1% three days in a row, the market has been higher a year later 86% of the time since 1950 with a median gain of 20%.
Sentimentrader tweeted Wednesday that the NASDAQ has fallen to a 52-week low followed by two gains of at least 2.5% on back to back days only five times in history. Four of those marked multi year lows.
While these statistics are interesting I don’t like to invest based off of them for a couple reasons. First, statistics are easily manipulated. I can massage the data to make it come out the way I want. Second, every historical moment is unique. History does not repeat; it rhymes. While historical analysis can – and should – inform one’s perspective on the present, the situations – and therefore the outcomes – are never identical.
My preferred method is to use all the resources at my command – including historical precedents – to analyze the primary forces in play at a given moment and make my forecasts based on that. And when I do so I still see the following headwinds: the worst inflation in at least 40 years, rising interest rates, a popping asset bubble, war. Just because the stock market went up three days in a row doesn’t change any of these realities. In my opinion, these are still early days in what is likely to be an epic bear market.