WBA Is Deep Value
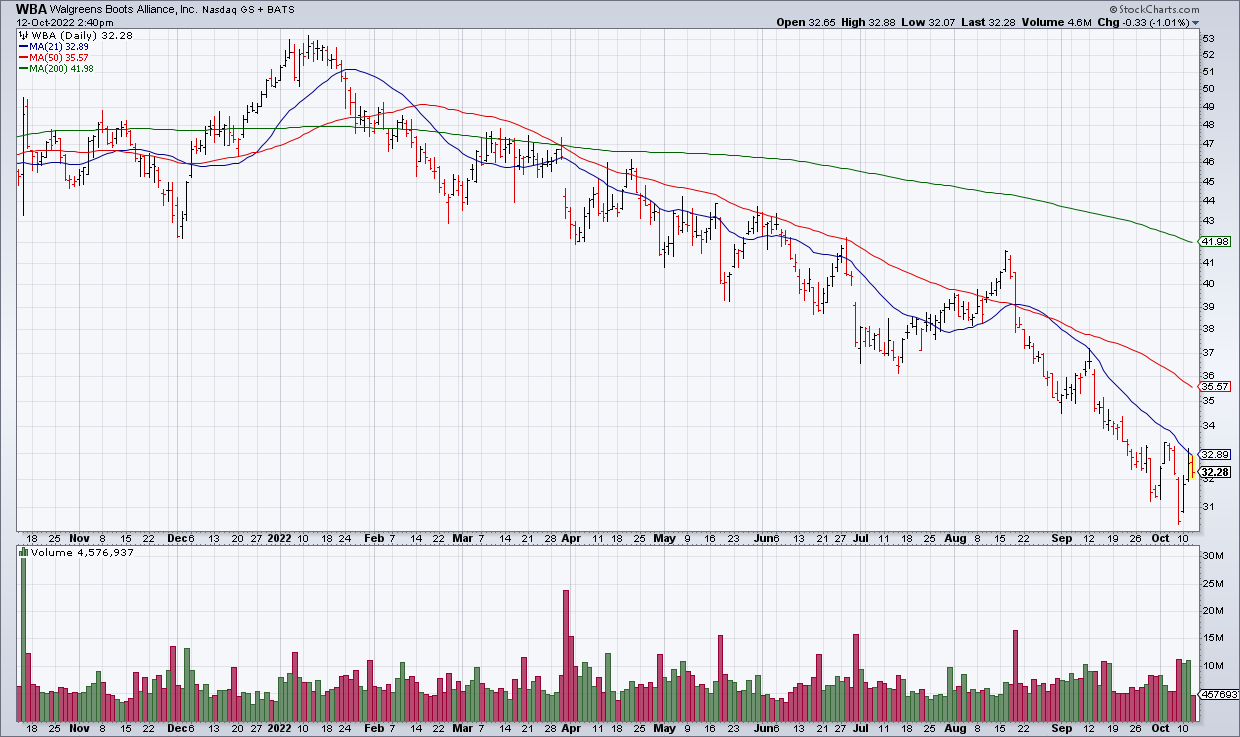
When I see a chart like the one above of leading drugstore Walgreens (WBA) I want to find out why it’s essentially straight down. For example many tech stocks have charts that look like WBA’s this year due to rising interest rates. Rising rates increase the discount rate at which tech stocks’ future earnings are valued therefore substantially reducing valuations. Another possibility would be problems operating the business. But as hard as I look I just can’t find an explanation which makes me think that WBA represents deep value at this point.
WBA earned $5.31/share in the year ended August 31, 2021 and has guided to low single digit growth in FY22 which they will be reporting tomorrow morning. Even if earnings take a hit in FY23 to say $5/share WBA is still trading at only 6x forward earnings. That’s too cheap for a quality business. In addition WBA pays a 6% dividend. That’s a juicy yield. Unless I’m missing something – and I’ve been wrong on the stock for six months now – WBA is significantly undervalued and due for a bounce.
UPDATE: WBA just reported earnings and they look good to me. In the above blog post I mistakenly wrote that WBA earned $5.31/share in FY21 but that included non-continuing operations. The relevant metric is what they earned from continuing operations and that was $4.91. As a result I overestimated what they’d earn in FY22 and FY23. They earned $5.04 in FY22 and guided FY23 to $4.45-$4.65. Nevertheless the core argument of the post stands: At 7x forward guidance with a 6% dividend WBA represents deep value and excellent current income. The stock is +4% in the premarket.