Would You Buy This Chart?
A fun and interesting excercise in technical analysis from The Big Picture.

A fun and interesting excercise in technical analysis from The Big Picture.

Friday was an interesting day in which smaller stocks outperformed mega cap tech – the opposite of what’s happened so far this year. The Russell 2000 (IWM) was +2.92% while the Nasdaq 100 (QQQ) was up only 0.29%. IWM broke…
Note: To sign up to be alerted when the morning blog is posted to my website, enter your name and email in the box in the right hand corner titled “New Post Announcements”. That will add you to my AWeber…
Note: A few months ago I started writing a daily morning market email for clients, friends and family. I recently decided to start making this email more broadly available. Email me at gfeirman@topgunfp.com if you’d like to be added to…
Note: To sign up to be alerted when the morning blog is posted to my website, enter your name and email in the box in the right hand corner titled “New Post Announcements”. That will add you to my AWeber…
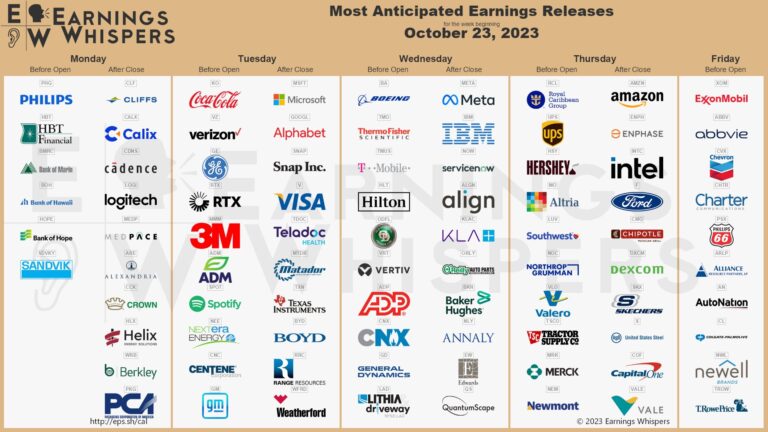
The market weight S&P 500 closed just below its 200 DMA Monday as we head into the heart of 3Q23 earnings season with Google (GOOG/GOOGL), Microsoft (MSFT), Facebook (META) and Amazon (AMZN) all reporting earnings this week. As Karen Langley…
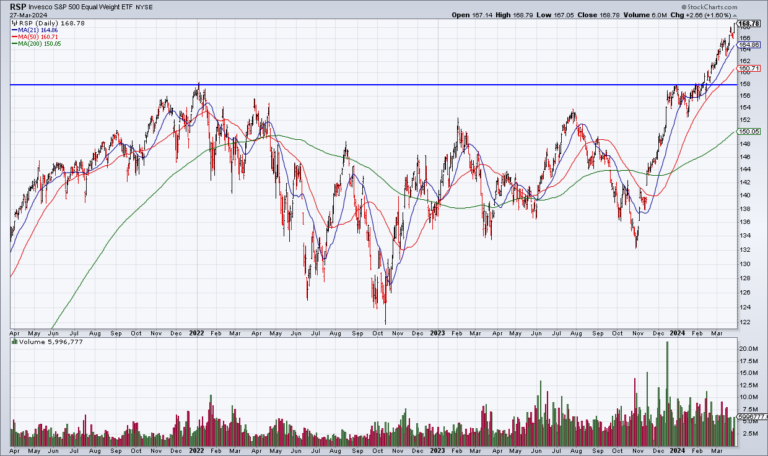
It’s getting harder and harder to make a bearish technical case against stocks. For a while, the argument was that the Magnificent 7 – with their huge size – were carrying the market higher and masking a lot of weakness…