Top Gun FP Client Note: Deja Vu All Over Again
NOTE: Every week I write a Client Note for my clients. For a limited time, I am allowing non-clients to sign up and receive the Client Note. You can sign up at the top right hand corner of the website. I will also be posting the notes on my blog with a 24-48 hour delay from time to time. Here is this week’s.
*****
I believe the previous three weeks action, which included six high volume selloffs, marks the end of the junk phase of the rally. From peak to trough the S&P 500 sold off about 100 points (8.70%) from Tuesday January 19 to Friday February 4. However, as I emphasized in last week’s Client Note, the leading stocks of the rally sold off far more, generally about 15%.
This is an important development marking a real character change in the market. The days of buying Citigroup, Goldman Sachs, tech and emerging markets, and watching them go up relentlessly, day after day, are over. The easy money has been made.
Perhaps Friday’s intraday reversal and today’s rally on heavy volume mark the end of the correction as well.
*****
What comes next?
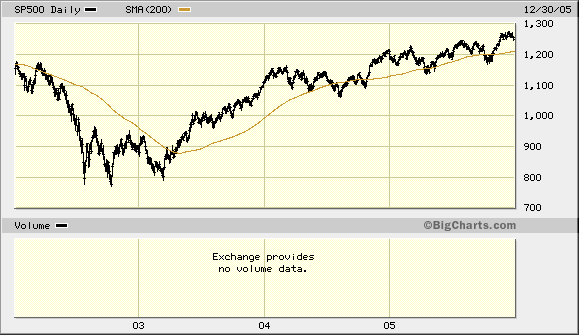
Perhaps the best historical analogy comes from the previous cycle. As the stock market and economy tanked in 2000 due to the bursting of the tech bubble, the Federal government went into high gear. Greenspan began furiously cutting the Fed Funds Rate and Bush pushed through substantial tax cuts in 2001. Greenspan continued lowering the Fed Funds Rate, eventually getting it all the way down to 1% in 2003. That same year Bush pushed through further tax cuts on capital gains and dividends.
Eventually, all this stimulus stabilized the economy and financial markets, which began a spectacular rally in March 2003. From a low of 789 on March 11, the S&P roared all the way to an 1155 close on January 26, 2004 – a 46%, 10 month advance.
This was not, however, the beginning of a new and powerful secular bull market. The S&P 500 climbed only another 57 points (5%) the rest of the year, finishing 2004 at 1212. The S&P followed that with a lackluster 2005, rising only 36 points (3%) the entire year.
With minor differences, the parallels to the current cycle are striking. Bernanke followed pretty much the same playbook as Greenspan, though he did take it farther, lowering the Fed Funds Rate all the way down to 0% and implementing a range of Quantitative Easing programs. There was also the $700 billion TARP this time around. Instead of cutting taxes, Obama increased spending via the February 2009 stimulus act (The American Recovery And Re-Investment Act; Bush’s 2001 tax cut was called The Economic Growth And Tax Relief Reconciliation Act).
If the historical analogy holds, it suggests the market could be stagnant and range bound for the rest of 2010.
YTD Returns (through 2/4)
S&P: -4.39%
DJ Total: -4.28%
Top Gun: +0.10%
Greg Feirman
Founder & CEO
Top Gun Financial (www.topgunfp.com)
A Registered Investment Advisor
9700 Village Center Dr. #50H
Granite Bay CA 95746
(916) 224-0113
CALL NOW FOR A FREE INITIAL CONSULTATION!