When The Market Lulls You To Sleep
NOTE: Every week or two I wrote a Client Note for my clients. I post the notes to my blog but with a time delay usually between 1 day and 1 week. To receive the Client Notes at the same time as my clients, sign up in the box in the right hand corner of the website.
*****
Could the market be any duller the last two weeks? Here are the % changes in the S&P the last 10 trading days:
Not only are the price movements minuscule but volumes are the lowest of the year. Five day trailing volume in the benchmark SPY ETF through Friday August 10th was the lowest since 2007 excluding Christmas weeks. Volumes dropped even more last week. But beneath the calm some important things are happening.
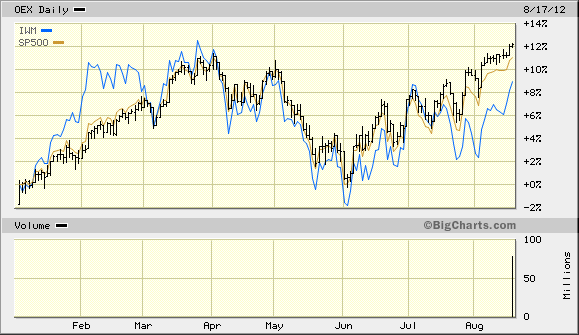
We are 11 weeks into a rally that has taken the S&P to within 1 point of its bull market closing high (4/2/12: 1419). Notably, however, this scorching rally is being led by the biggest and most boring stocks in the market. The chart below shows that while the Russell 2000 – an index composed of 2000 small cap stocks – led the rally in the first part of the year, the S&P 100 – the 100 largest companies by market cap in the S&P 500 – has led during the current leg.
In general, one would expect to see the reverse for a healthy rally in a growing economy. That’s because smaller companies have a lower base and larger market opportunity from which to grow while the behemoths in the S&P 100 have mostly saturated their markets.
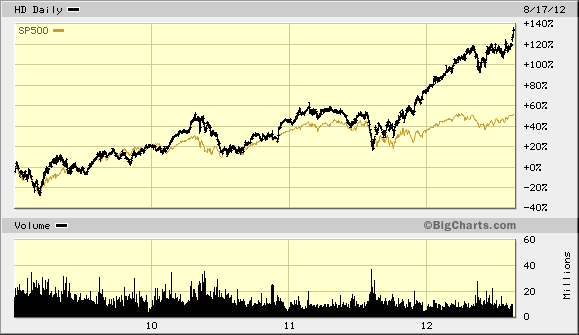
A perfect example of the kind of stock leading this rally is $83 billion market cap Home Depot (HD), which reported earnings Tuesday morning. For the first two and a half years of the bull market, Home Depot essentially traded in line with the overall S&P 500. However, since the lows last October HD has massively outperformed. Certainly, HD’s results have been good with EPS up 24% in the last year through July 29 compared to the year ago period.
However, a look beneath the surface shows the limits to this kind of market leadership. The first thing to note is that HD has not been building new stores as it has in the past. In fiscal 2011, they opened 4 new stores in the US, including 2 relocations, and closed 4 stores. Few new stores have been opened in the first two quarters of this year either. A recovery in the housing market has led to good same stores sales and a 4% increase in revenue.
But the real driver of HD’s earnings growth has been a reduction in operating expenses, not top line growth. As a result of keeping a tight lid on expenses, HD expanded its operating margin to 10.1% in the last 12 months compared to 9.0% the previous year. That is responsible for about 75% of their operating income growth. A significant stock buyback also contributed to their EPS growth.
There are limits to cutting operating expenses and buying back stock. A market led by this sort of stock can only go so far. (I did the same sort of analysis on IBM’s 1st quarter in “The Quality of Earnings”, May 1).
Further, these stocks are not cheap anymore. Three weeks ago, I included a chart showing that the telecom stocks are more expensive relative to the overall market than at any other time in at least the last 17 years (see “Bear Market Premonitions”, July 25). The same applies to HD which is trading at more than 19 times their $2.95 forecast for this year.
Beneath the calm surface, this market is sputtering and running out of gas. It won’t be long before it stalls and then reverses.


