Interpreting TGT Versus WMT Earnings
Just a day after blowout earnings from Walmart (WMT), Target (TGT) laid an egg with its own 3Q22 earnings report this morning. While WMT raised its full year comparable sales guidance TGT cited a “meaningful softening” of business in the latter weeks of the quarter and into November. What gives?
The key is the different mix of items the two retailers sell. In short WMT sells predominantly necessities while TGT sells a much higher proportion of discretionary items. With consumers under pressure due to inflation and a weakening economy they are cutting back on the latter. That’s how WMT can outperform while TGT struggles.
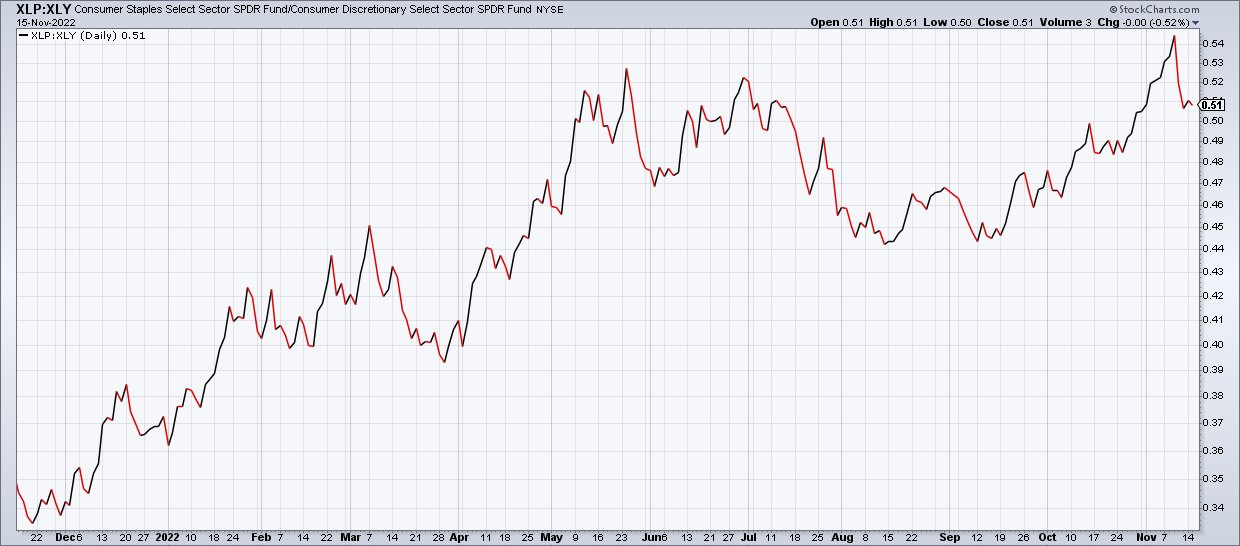
You can see this in the chart above of the S&P Consumer Staples ETF (XLP) versus the S&P Consumer Discretionary ETF (XLY). The former has companies like Procter & Gamble (PG) Costco (COST) and WMT. The latter has companies like Amazon (AMZN) Tesla (TSLA) Home Depot (HD) and TGT. As you can see XLP is in a nice uptrend relative to XLY which makes sense if the economy is weakening. That’s because consumers still need to buy necessities like food and toothpaste but can cut back on discretionary items like apparel and home improvement.
The big picture takeaway is that the economy is weakening and will probably roll over into a recession next year. In the current environment defense wins championships.