Top Gun FP Client Note: The Fear Beneath The Surface
NOTE: Every week I write a Client Note for my clients. For a limited time, I am allowing non-clients to sign up and receive the Client Note. You can sign up at the top right hand corner of the website. I will also be posting the notes on my blog with a 24-48 hour delay from time to time. Here is this week’s.
*****
The market’s still a little stunned and shaky after the last three days of last week.– Art Cashin, Floor Trader, UBS
Last week was pretty interesting. The sense I got was that the earnings reports were actually pretty good but the market action was not. Sometimes this kind of thing can suggest that all of the good news is already priced in to the market.
The key days were Thursday and Friday when the S&P dropped 46 points (4.04%). What especially caught my attention about the selloff those two days was the heavy volume. Take a look at the below chart of NYSE Composite Volume for each of the 16 completed trading days of 2010.
| Day | Date | NYSE Composite Volume |
% Difference From Year Average |
| Tue | 1/26/10 | 4,826,652,979 | -2.7% |
| Mon | 1/25/10 | 4,602,212,401 | -7.2% |
| Fri | 1/22/10 | 6,384,803,838 | 28.7% |
| Thu | 1/21/10 | 7,021,785,569 | 41.5% |
| Wed | 1/20/10 | 4,922,843,735 | -0.8% |
| Tue | 1/19/10 | 4,752,795,679 | -4.2% |
| Fri | 1/15/10 | 4,930,550,553 | -0.6% |
| Thu | 1/14/10 | 4,040,467,652 | -18.5% |
| Wed | 1/13/10 | 4,286,373,829 | -13.6% |
| Tue | 1/12/10 | 4,842,070,264 | -2.4% |
| Mon | 1/11/10 | 4,354,271,071 | -12.2% |
| Fri | 1/8/10 | 4,506,612,916 | -9.2% |
| Thu | 1/7/10 | 5,419,781,753 | 9.3% |
| Wed | 1/6/10 | 5,090,936,980 | 2.6% |
| Tue | 1/5/10 | 5,266,194,179 | 6.2% |
| Mon | 1/4/10 | 4,122,104,159 | -16.9% |
| AVERAGE | 4,960,653,597 |
The far right column shows how big the volume was last Thursday and Friday relative to other days this year. Thursday’s volume was 41.5% above and Friday’s 28.7% above the year’s average volume. Technicians equate volume with conviction and this kind of volume suggests real fear and conviction.
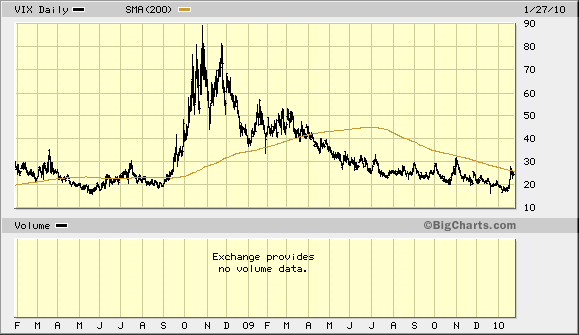
Also supporting the case for real fear was the big jump in the Volatility Index. The VIX jumped 31.6% on Thursday and Friday to close at 27.31, just above its 200 day moving average. The 200 DMA has served as resistance during the 10 month rally since March and a look at the chart shows it’s a technical level worth watching.
The market action is clearly bearish the last week. Whether it is the beginning of a bigger correction only time will tell.
Greg Feirman
Founder & CEO
Top Gun Financial (www.topgunfp.com)
A Registered Investment Advisor
9700 Village Center Dr. #50H
Granite Bay CA 95746
(916) 224-0113
CALL NOW FOR A FREE INITIAL CONSULTATION!