Inside Thursday, Semiconductor Mania and The Financials
Note: To sign up to be alerted when the morning blog is posted to my website, enter your name and email in the box in the right hand corner titled “New Post Announcements”. That will add you to my AWeber list. Each email from AWeber has a link at the bottom to “Unsubscribe” making it easy to do so should you no longer wish to receive the emails.
What happened yesterday was very interesting and captured beautifully in a tweet and chart by Yuriy Matso: “Everyone is selling their large cap tech stocks in order to buy more small cap stocks” (Tweet and Chart Source: Yuriy Matso Twitter, January 14, 2:21 pm PST).
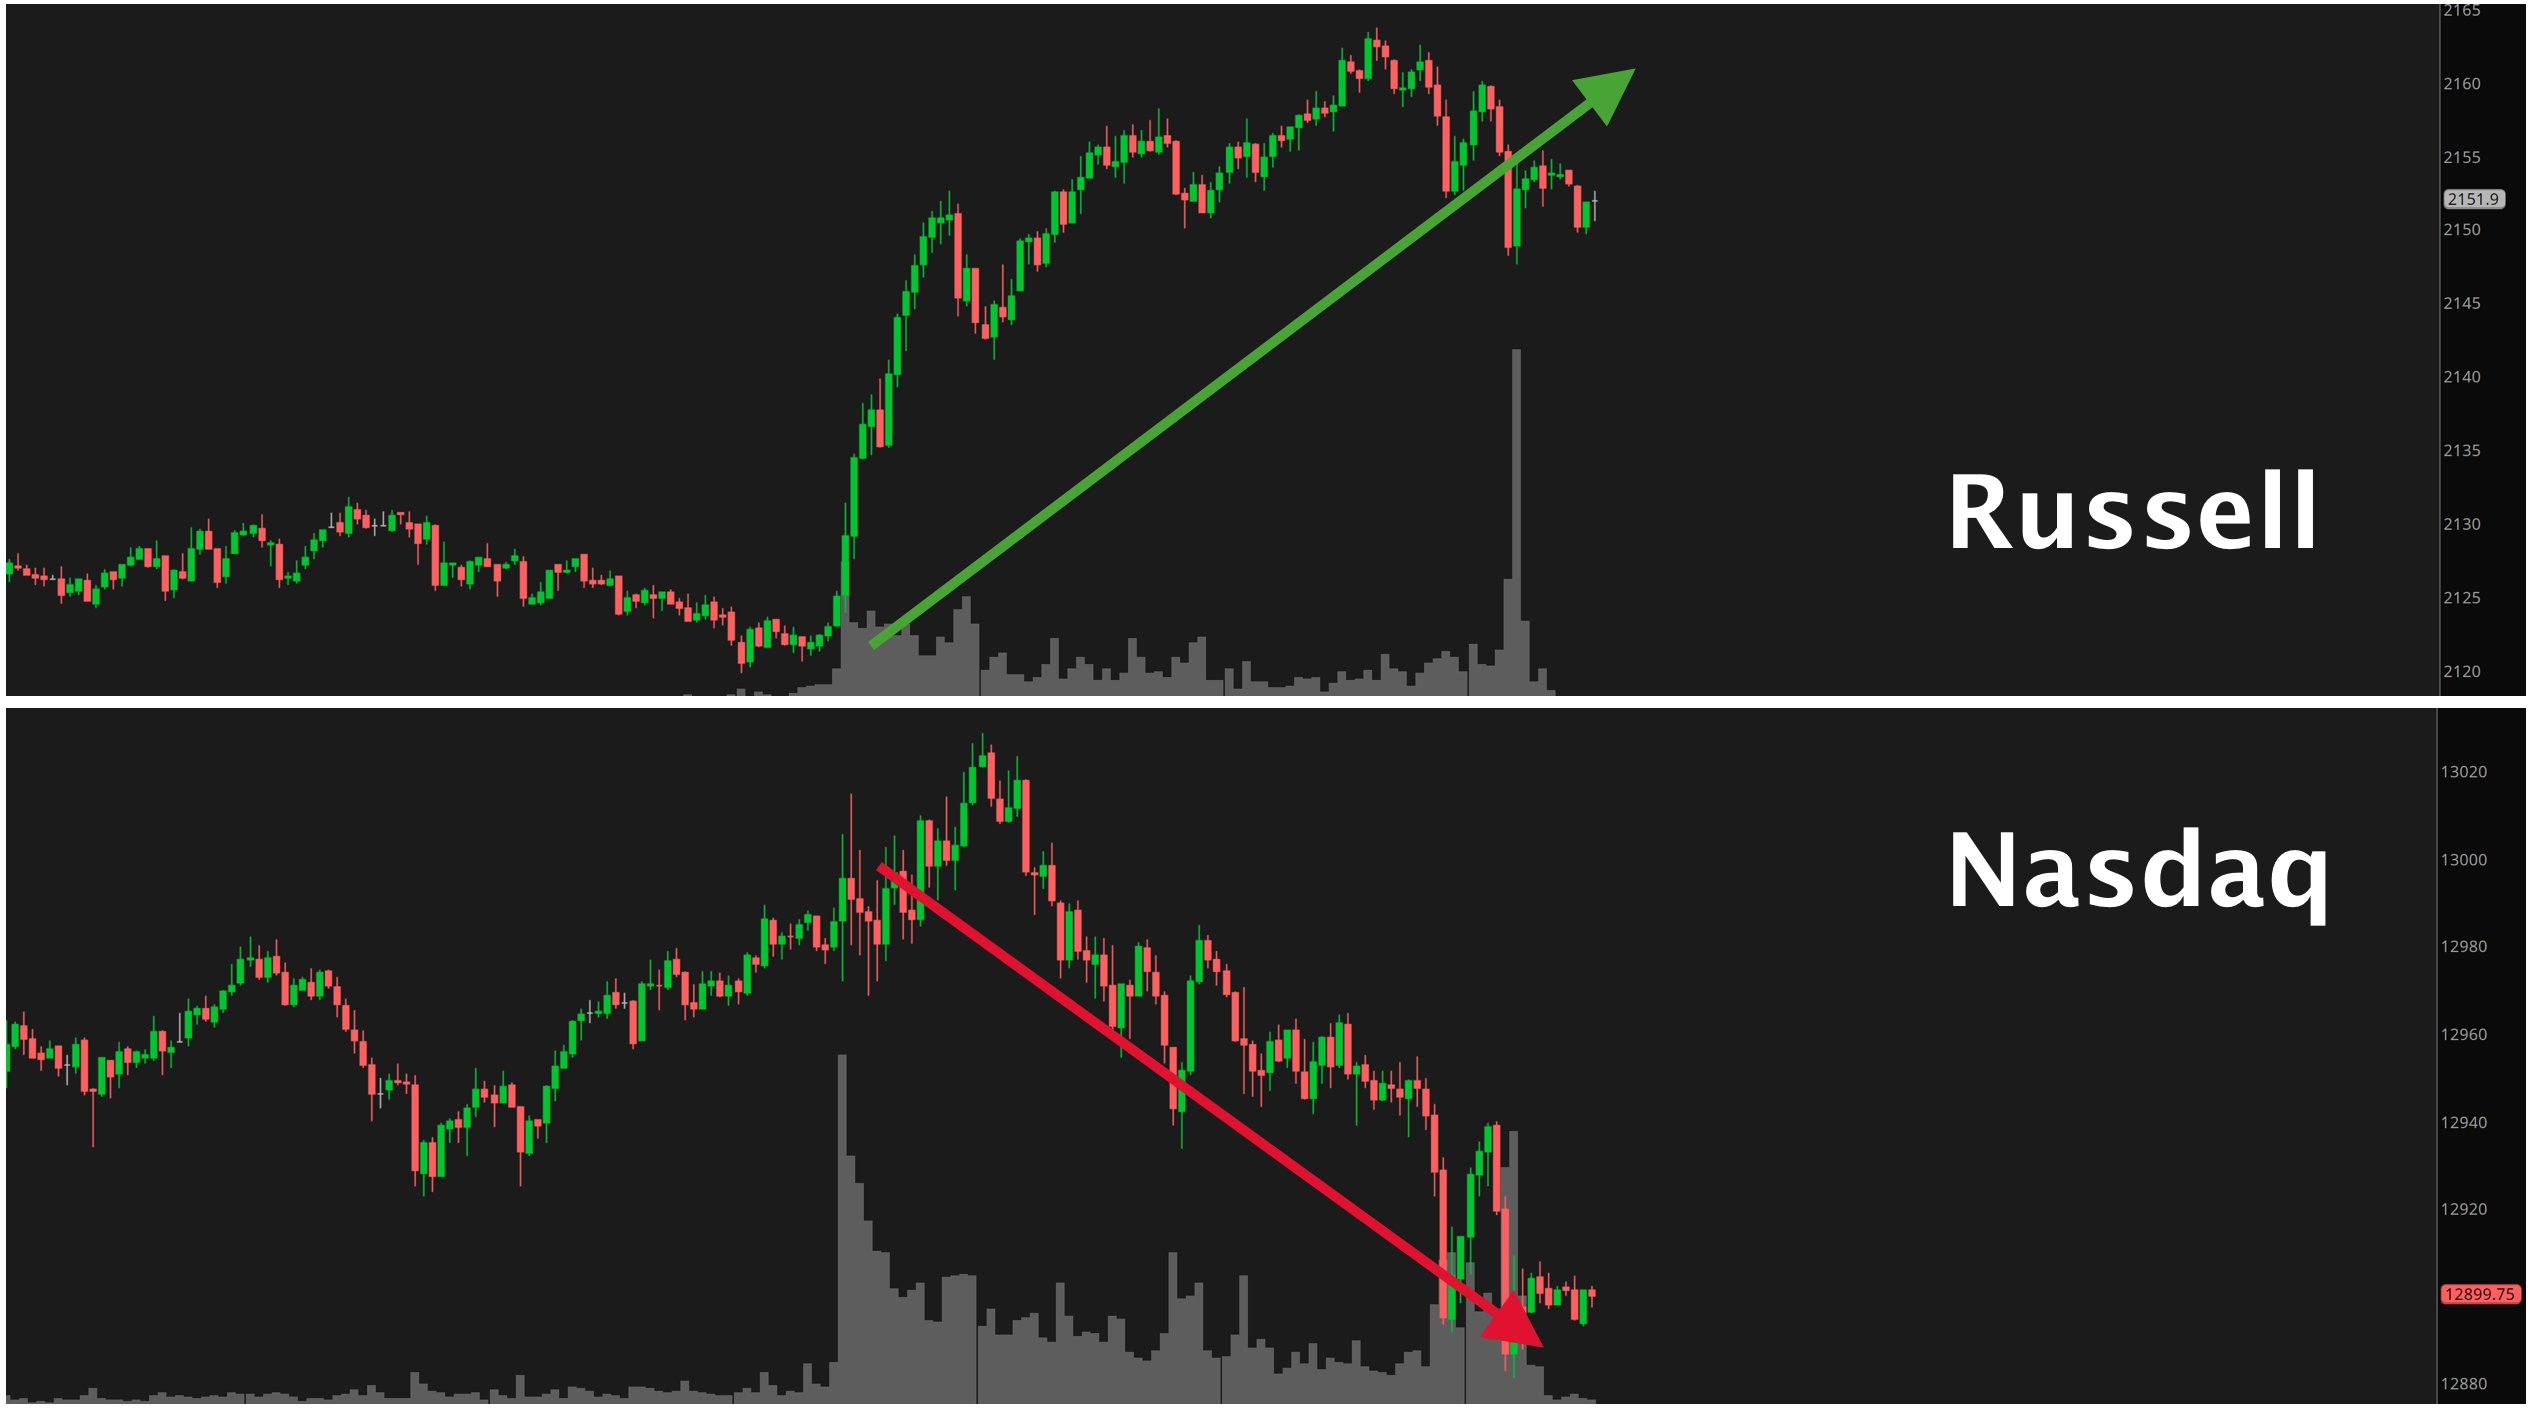
As you can see, the Russell 2000 gained strength all day long as the Nasdaq lost it with the former finishing +2.05% and the latter -0.12%.
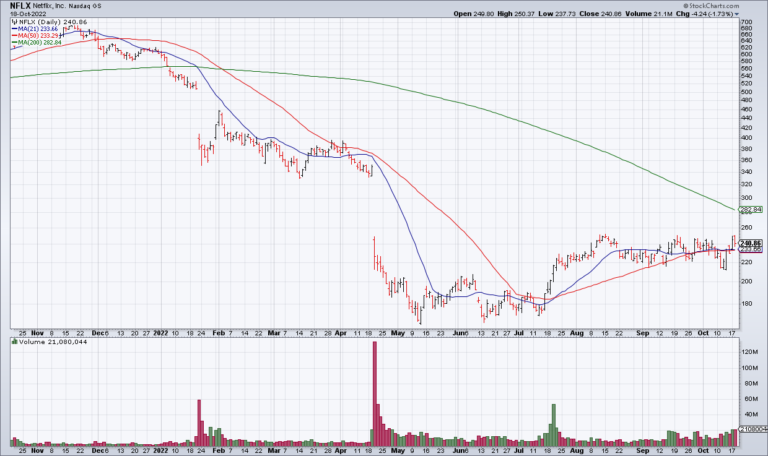
The NASDAQ is dominated by the Big 6 (AAPL AMZN MSFT GOOG GOOGL TSLA FB) and, as you can see in this chart from Gregory Krupinsky, at least the biggest 4 of the 6 are currently stuck in sand (Chart Source: Gregory Krupinsky Twitter, January 13, 4:04pm PST).

Krupinsky writes: “These have not been very exciting lately but look out if these get going”. An alternative interpretation is that these have been the leaders and are topping out first as bull market tops are a process (for an excellent extended and historically informed discussion see Paul Desmond, “An Exploration of the Nature of Bull Market Tops”, Lowry’s) whereas bottoms are an event. Only the price action will confirm which interpretation is correct.
In my next life I want to come back as a semiconductor – Ryan Detrick Twitter, January 14, 7:12am PST
One sector that is not stuck is semiconductors. The semiconductors are frequently played through their two major ETFs, SOXX and SMH, which were +2.12% and +2.49%, respectively, yesterday. And it wasn’t just yesterday. 2kaykim beautifully captured the SMH’s incredible move off the March lows (Chart Source: 2kaykim Twitter, January 14, 9:39am PST).
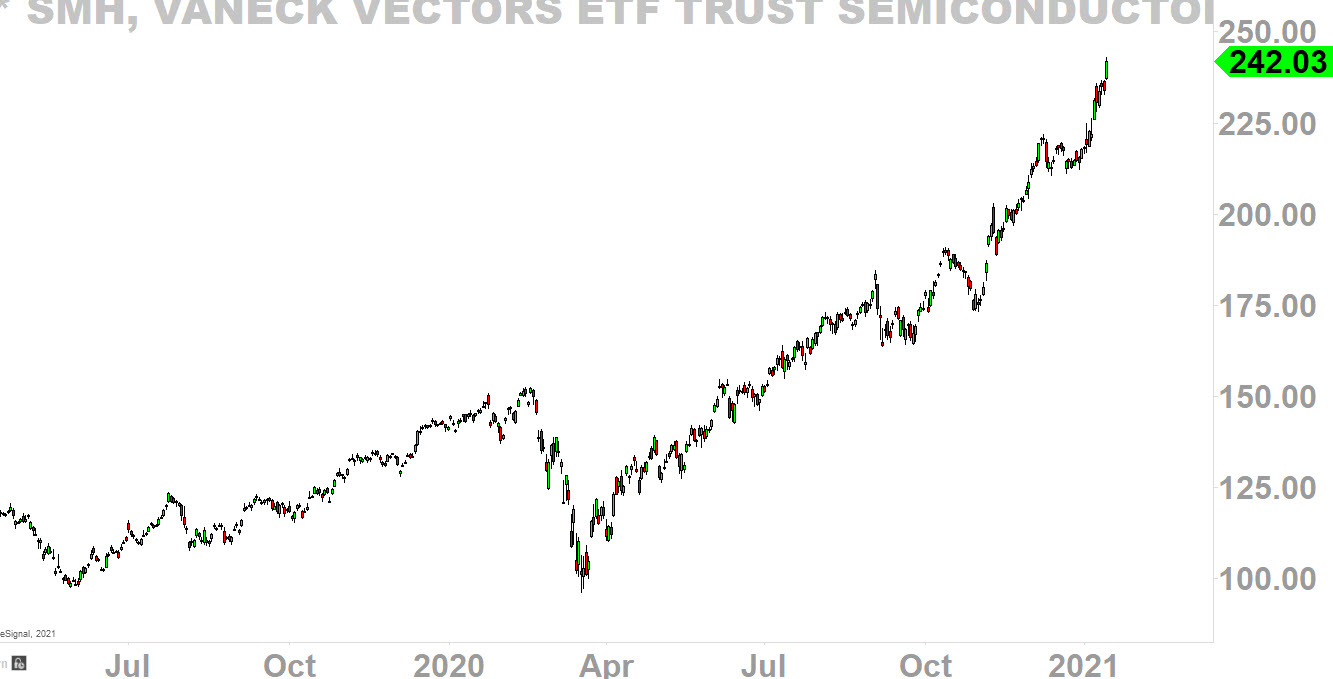
Taiwan Semiconductor (TSM) at 14% and Nvidia (NVDA) at 6% are the two largest components of the SMH and trading at 37x and 60x Trailing 12 Month EPS, respectively.
In addition, as you can see, the chart is starting to go parabolic and looks to me like a potential blow off top a la TSLA and Bitcoin (“When The Chart Goes Parabolic It’s Time To Sell”, Top Gun Financial, January 8).
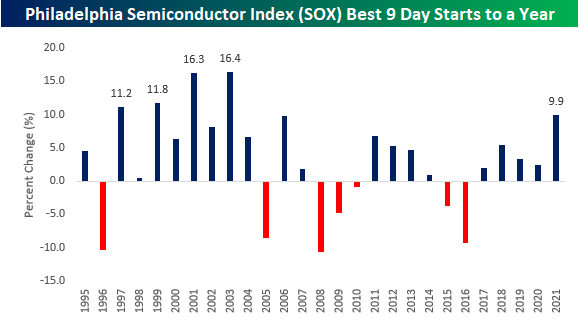
Semiconductors are off to their best start to a year since 2003. This trend is closer to the end than the beginning IMO (Chart Source; BeSpoke Twitter, January 14, 8:20am PST).
Lastly, I’d like to say a word about the financials. The spread between the 10 year and 2 year treasury continues to grow boosting banks’ Net Interest Margin and the stocks have responded (Chart Source: Liz Ann Sonders Twitter, January 14, 4:11am PST; Chart Source: 2kaykim Twitter, January 12, 9:52am PST).
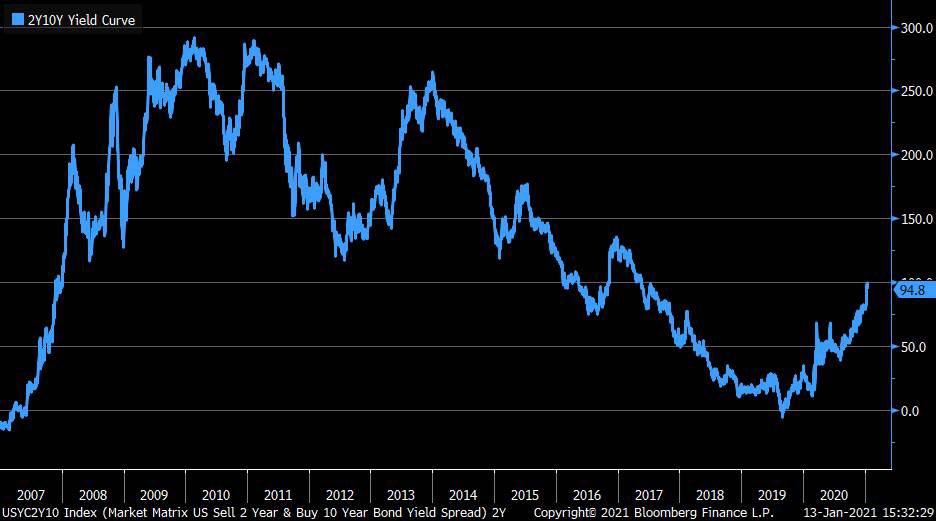

(Note: 2kaykim’s chart is from Tuesday intraday but is still relevant as the XLF closed Thursday at $31.46).
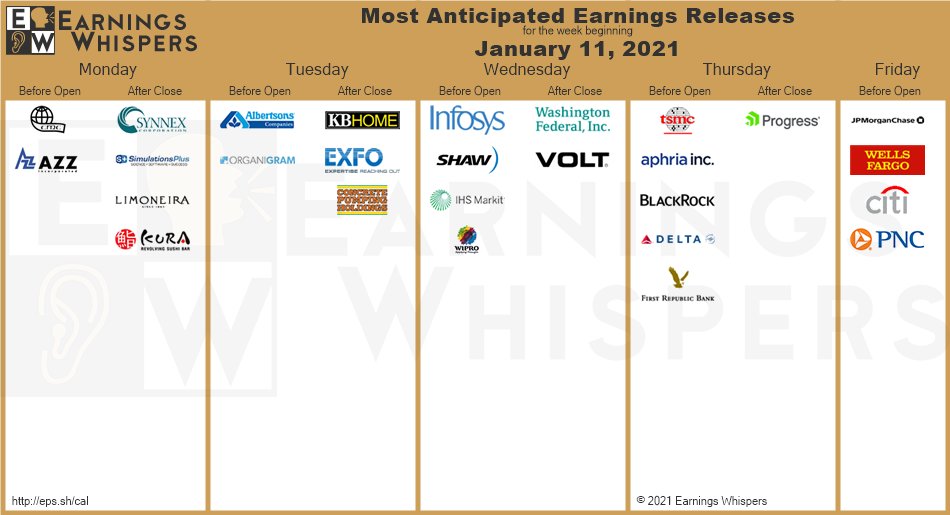
We will learn more this morning as JPM just reported (4am PST) and WFC & C will report in 40 minutes (5am PST). Note that yields only started to really move up this year, with the 10 Year Treasury yield up 21 basis points in the first 9 trading days of the year so this won’t start impacting bank earnings until this quarter. That was evident in JPM’s report in which its Interest Rate Spread was 1.74% compared to 1.75% in 3Q20.