Is The Rotation From Growth to Value or Offense to Defense?, Monday’s Bizarre Internals and What They Might Mean
Note: To sign up to be alerted when the morning blog is posted to my website, enter your name and email in the box in the right hand corner titled “New Post Announcements”. That will add you to my AWeber list. Each email from AWeber has a link at the bottom to “Unsubscribe” making it easy to do so should you no longer wish to receive the emails.
Most analysts have been characterizing the current rotation in markets as from Growth to Value. However, while on Monday the S&P 500 Value ETF (IVE, -0.02%) outperformed the S&P 500 Growth ETF (IVW, -1.95%), on Tuesday growth (-0.43%) outperformed value (-1.35%). This calls into question the Growth to Value narrative.
Dave Keller argues in the above tweet that the move is more about Offense to Defense. He makes this argument by comparing the performance of the S&P Consumer Staples Sector (XLP) with the S&P Consumer Discretionary Sector (XLY). The former outperformed the latter on both days: 0.76% > -1.78% (Mon) and -0.87% > -1.13% (Tue). The same thing applies to the equal weight ETFs, RHS and RCD: 0.99% > -0.63% (Mon) and -1.34% > -2.01% (Tue). The numbers, therefore, seem to support Keller’s contention.
However, if correct, this means that it is not a rally from Offense to Offense, from Tech to Value Reopen, which would maintain a risk on character to the market. Offense to Defense is by definition risk off. Keller’s point, while I don’t think the above argument proves it, makes some sense to me and suggests that something more sinister could be taking place in markets. Just a thought.

A closer look at Monday’s bizarre internals also suggests potential market exhaustion. The major indexes were both notably down with the S&P -1.04% and the NASDAQ -2.55%. NYSE + NASDAQ Breadth was unabashedly negative at 2095 Advancers to 5496 Decliners, as you’d expect on such a big down day. The anomaly was that 44% of S&P components hit 52-week highs – the most since 1943. So while the great majority of the market was getting hit, a very substantial number of S&P components bucked the trend to make 52-week highs. However, the sixth highest number since 2004 of S&P components also experienced buying climaxes as can be seen in the above chart by Sentimentrader. A buying climax is when a stock surges to a 52-week high before selling off to close below the previous days close. It suggests market exhaustion in the particular security. I’m not sure what to make of this but yesterday’s action might give us a clue.
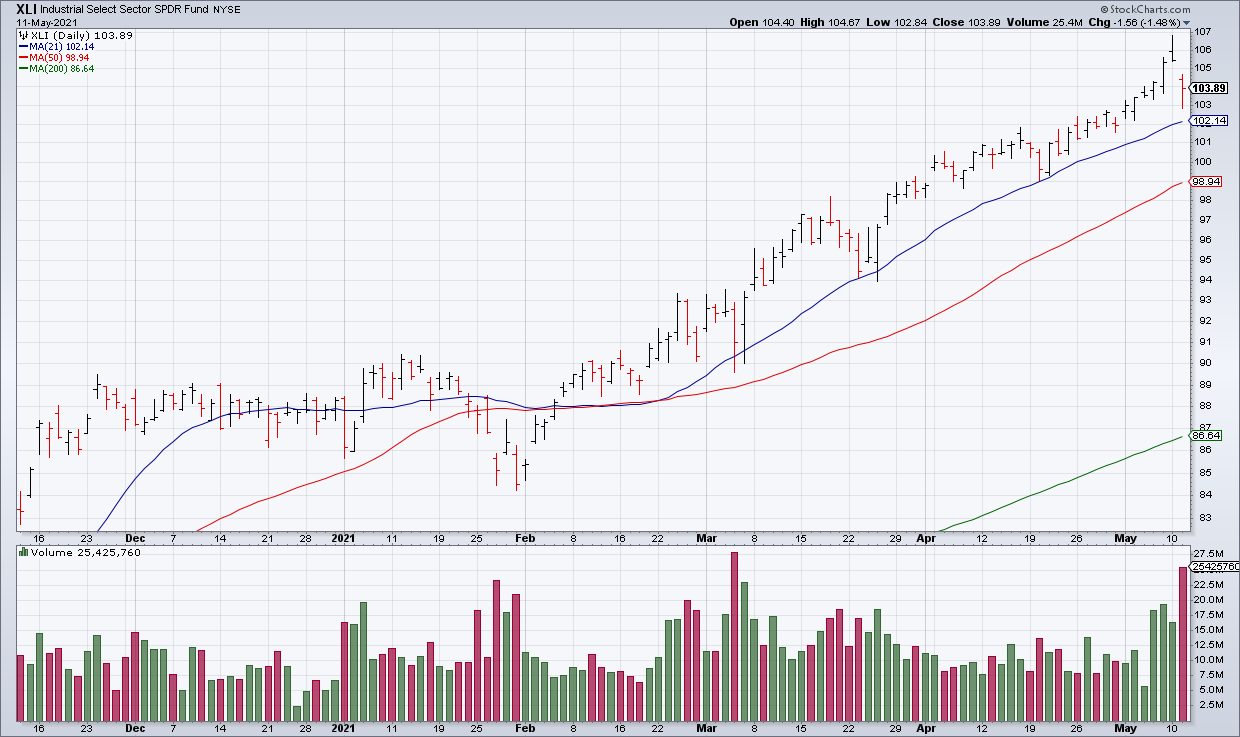
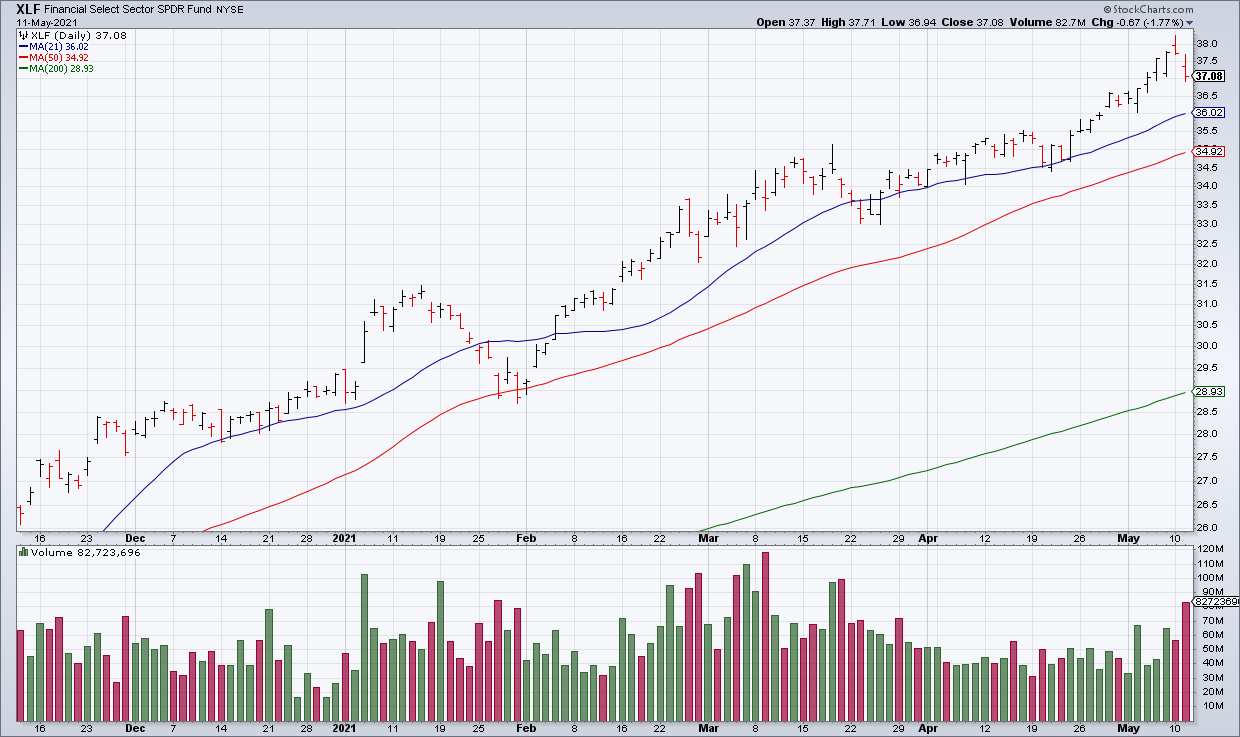
I am guessing that a number of the S&P stocks that made 52-week highs Monday were from the quintessential Reopen Value sectors, the Industrials (XLI) and the Financials (XLF). However, these sectors were sold hard Tuesday with the XLI -1.49% and the XLF -1.77%. These are the stocks that have been leading the S&P higher while the NASDAQ has rolled over. If they, too, are now rolling over, this market doesn’t have a leg to stand on.
I’ve tried to pull together a lot of technical data in this piece to make the far from air tight case that the market may be exhausted. The next few days should tell us if this is the case as neither the quintessential Reopen Value sectors, XLI and XLF, or Tech as represented by the NASDAQ and QQQ should be able to rally much and the rotation from Offense into Defense, Consumer Discretionary into Consumer Staples, should continue. I’m not much for top calling as I’ve failed at it too many times in the past but if things play out this way it is on the table.