Revisiting Thursday
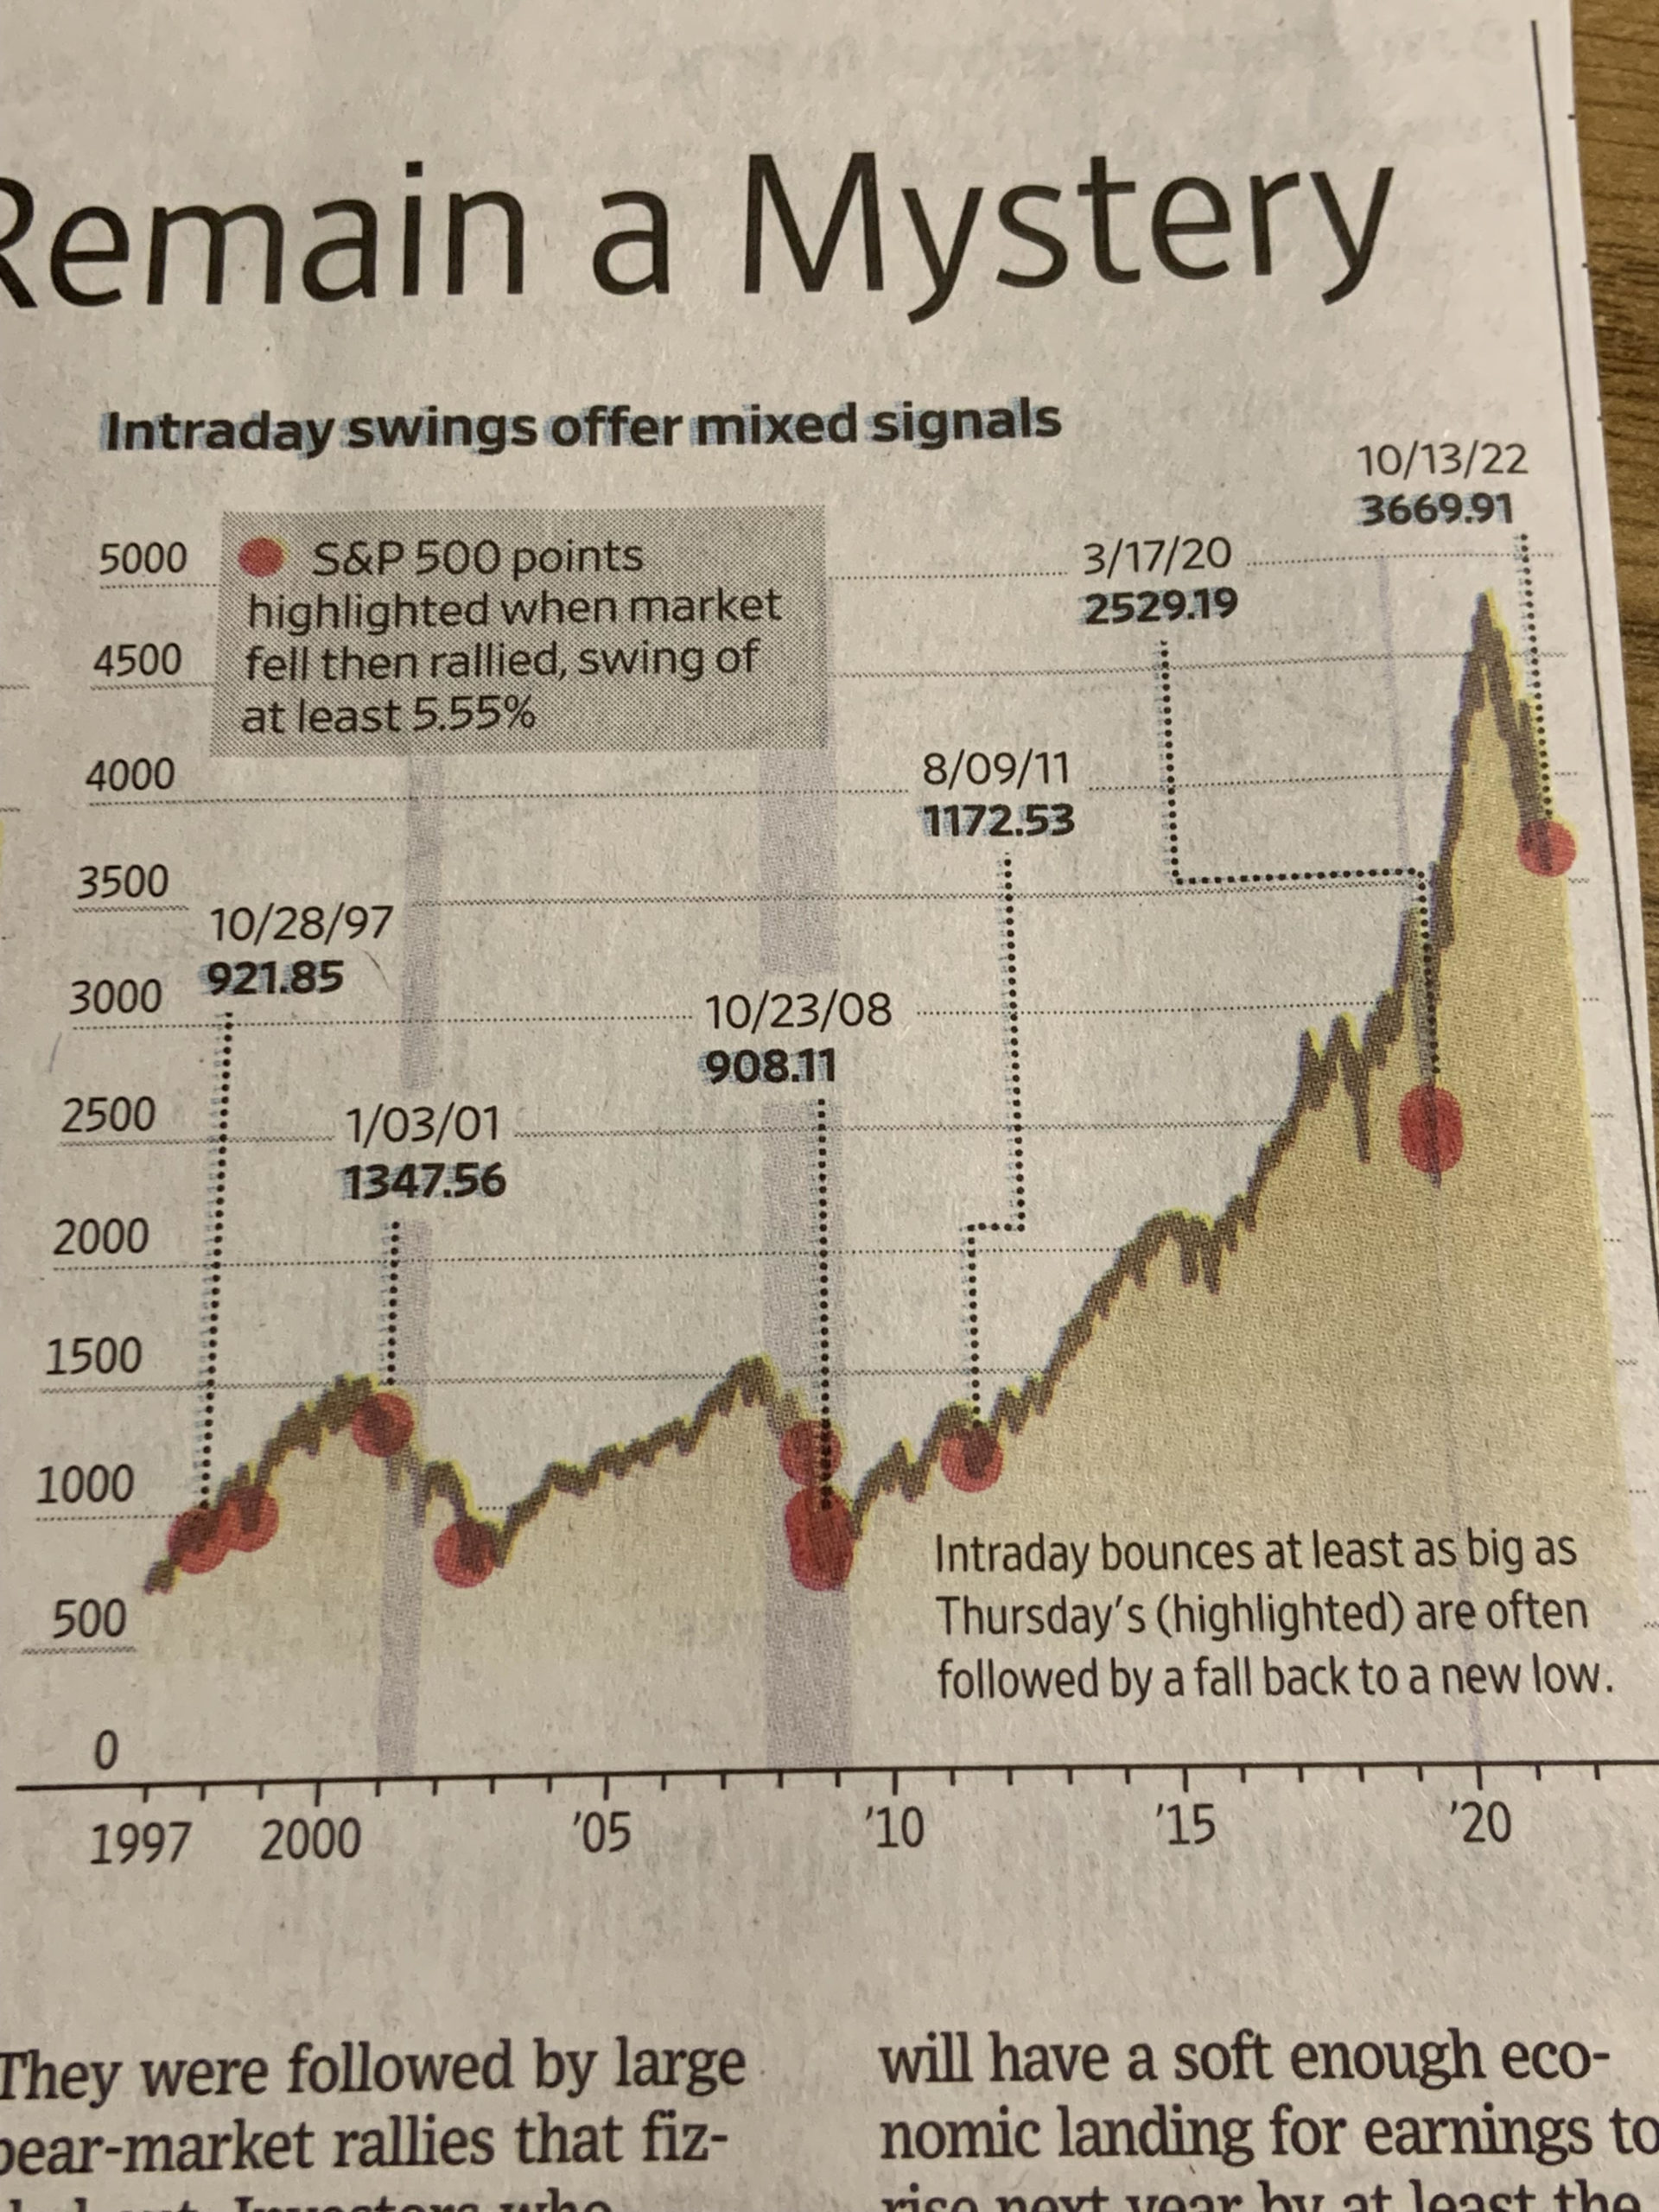
It’s been a few days since last Thursday’s stunning reversal giving us some time to sort out what it means. As predicted some found technical analogies to support the idea that the price action suggested a bottom was near. The best piece of analysis regarding it is an article in today’s WSJ by James Mackintosh (“Market Swings Remain A Mystery” [SUBSCRIPTION REQUIRED], October 17).
In my blog post I suggested that last Thursday was in certain ways the inverse of what we saw when the market topped on November 22, 2021. In his article Mackintosh focuses on intraday reversals to the upside; instances when the S&P fell and then rallied with a swing of at least 5.55%. When I eyeball the chart and think back to the context of each instance I don’t believe we can dismiss them as meaningless. They seem to happen at times of great volatility and uncertainty and frequently do mark turning points.
In the end I think what each instance has in common is investors looking for and trying to pick market inflection points. The market is pure subjectivity. Prices are not an objective measure of some underlying reality. They are the views of all market participants according to weight. So what I think Thursday means is that many are now looking for – and primed to see evidence of – a bottom. For those so disposed Thursday’s action suggested that it might be at hand.
That’s worth knowing but by no means a guarantee since the chart shows that these attempts to pick inflection points are sometimes early (January 3, 2001, October 23, 2008). And that is my view: Many investors currently believe we are near the bottom and looking for a spot to put money to work – which explains a wild swing like we saw last Thursday – but they are early; the bear market still has a few more acts to go.