Sniffing Out A Housing Top

Two of the big public homebuilders – Lennar (LEN) and KB Homes (KBH) – reported FY1Q22 earnings in the last week. (Their fiscal year quarters ended on February 28, 2022). A look at their results – and the charts – suggest housing has topped.
Let’s start with LEN which is almost 8x larger than KBH with a market cap of $25 billion. The delta in new orders appears to have peaked in 2Q21 at about +30%. Deliveries held steady through the remainder of 2021 at about +10% but rolled over to flat in the most recent quarter. A look at the chart suggests a topping pattern beginning in May of last year with an inability to gain traction above $108 and a breakdown in 2022.
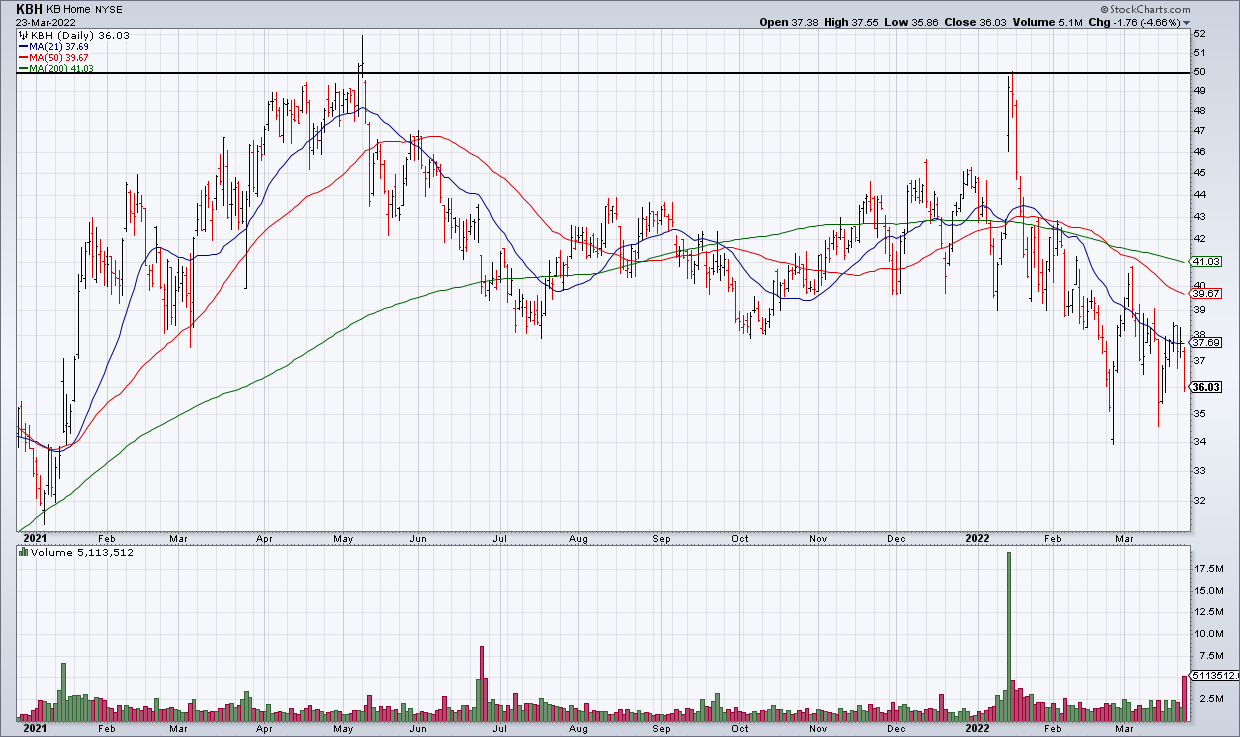
KBH reported Wednesday after the close and we can see a similar pattern. The delta in new orders appears to have peaked in 2Q21 at about +150%. Deliveries remained solid at +30% to +40% through the remainder of 2021 before rolling over to flat in the most recent quarter. KBH fell almost 5% Wednesday and is currently down another 4% in the premarket. The chart is similar though not identical to LEN with the smaller KBH showing more pronounced weakness since its May 2021 top.
(There is an analogy here between ARKK and QQQ in my opinion. The smaller, more speculative stocks started rolling over a year ago while the larger, more mature ones have held out longer but are starting to get hit this year. The Wall Street cliche that tops are a process while bottoms are an event seems apt).
The charts suggest Wall Street is sniffing out a housing top and rightly so based on my analysis of LEN and KBH earnings. This is important for the overall economy because the value of the US housing market is somewhere in the ballpark of $40 trillion – equivalent to the value of the S&P 500 – and makes up the biggest part of the wealth of the middle class. Add that to your mosaic for interpreting the ferocious rally we’ve seen over the past week.