The 200 DMA
Technical Analysis is bullshit. You can always find a line to draw that makes it look like support or resistance. For example, I remember technicians on Twitter talking about the 200 Week Moving Average being support at the end of last year. Not the 200 Day Moving Average – mind you – because the S&P was well below it. It was hilarious. Almost as funny is when they start talking about and drawing charts with Fibonacci Retracements. I love that.
These guys think they’re being so objective by relying only on price. “Price is truth”, they love to say. Give me a second while I laugh in their faces. The truth is that their lines are forecasts and they rely on the lines they want to. And the market couldn’t care less about their precious lines.
The only exception is the 200 Day Moving Average. That is the single most important indicator in all of Technical Analysis – and it is worth paying attention to. That’s because it’s so widely known and followed that it becomes like a self fulfilling prophecy. Investors are convinced that the 200 DMA matters – and so it does because the market is crowd psychology.
Willie Delwiche had an important tweet today in which he showed that it’s not being above or below the 200 DMA that matters but if the 200 DMA itself is rising or falling. Now even taking everything I said in the first paragraph about Technical Analysis being complete horseshit, I believe Willie is onto something. I’d be willing to bet that an investment strategy that was long things with rising 200 DMAs and short things with falling 200 DMAs would significantly outperform the market. I’ll throw that bone to the Trend Followers.
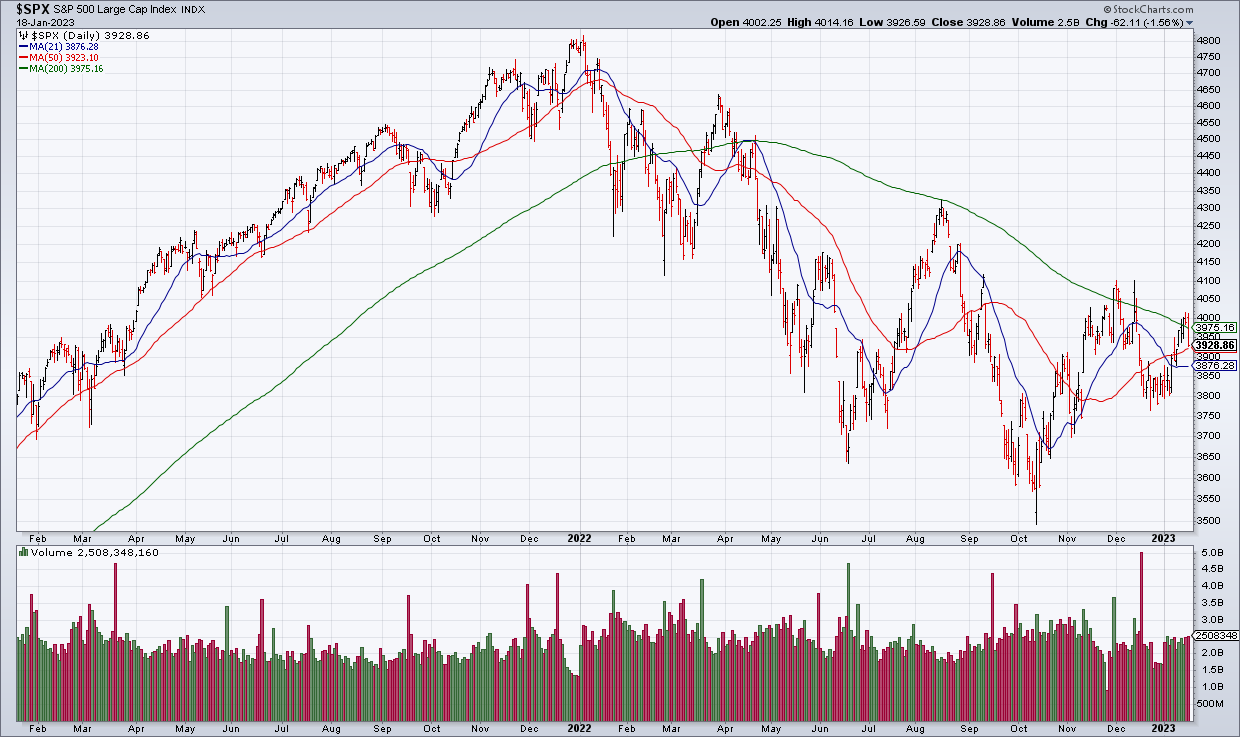

Which brings me to the charts of the S&P and TLT above. Both of them are currently testing their falling 200 DMAs from below. This is getting a lot of attention from investors. Technicians are placing their bets which are simply their biases refracted.
If you take what I said in the previous paragraph about the important thing not being above or below the 200 DMA but whether 200 DMA itself is rising or falling, both of these charts are sells. But actually they’re not.
I’ll tell you what’s going to happen and why. The S&P is going to fail at its 200 DMA because we’re headed for an earnings recession. Stocks will disappoint on a fundamental basis and go lower for that reason.
TLT – on the other hand – is going to break through its 200 DMA for the same reason. All the Fed’s tightening – and soon crashing asset prices – have created a deflationary environment which is bullish for bonds. That’s because risk assets are going down and you’re getting paid back in “strong” dollars in such an environment. And so long term treasuries will rally. But – again – not for anything having to do with the 200 DMA but because of fundamentals.