NOTE: Every week or two I write a Client Note for my clients. For a limited time, I am allowing non-clients to sign up and receive it at the same time as my clients. You can sign up at the top right hand corner of the website. I will also be posting the notes on my blog with a time delay from time to time.
Originally sent to clients April 11.
*****
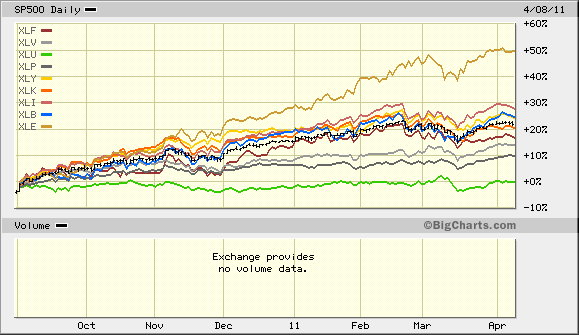
As usual, Jim Cramer best captured the spirit of the current market on Mad Money two Thursdays ago. On the last day of the 1st quarter, Cramer told his viewers that it was the
“obvious trades” that were working and would continue to work: Oil, Commodities and Industrials. A chart of the S&P 500 and its component sectors since last September shows that these sectors – especially energy -are driving the overall market.
The problem is that there are inherent limits to a commodity-led stock market. Consider oil which is currently at $112/barrel. This is great for oil companies. Imagine an oil company that sells 1 million barrels of oil per quarter. At $75/barrel, that works out to $75 million in revenue. At $100/barrel, revenue comes in at $100 million. Assuming costs remain constant, the increase in the price of oil goes straight to their bottom line.
The problem is that oil is a cost to other businesses and to individuals. Imagine a manufacturer which buys 10,000 barrels of oil per quarter. At $75/barrel, their cost is $750,000. At $100/barrel, the cost rises to $1,000,000. Assuming revenues remain constant, the increase in the price of oil hurts their bottom line.
The same thing applies to consumers. Imagine someone who uses 60 gallons of gas per month. At $3/gallon, they spend $180/month on gas. At $4/gallon, the cost for their gas increases to $240/month. Assuming their income stays the same, they now have $60 less to spend. That $60 has to come from somewhere. Maybe they buy one less Starbucks a week. Maybe they skip going to the movies on a Saturday night. Perhaps they hold off on buying that new pair of shoes they’ve had their eye on.
In other words, any benefit to oil and commodity producers from higher prices is offset in the overall economy as a cost to someone else. But it doesn’t stop there.
The manufacturer now has less profit to reinvest in his business. His ability to buy new machinery or hire new employees is reduced. The same applies to the businesses at which consumers cut back. Their sales at the margin go down as does their profit. Lower sales and less profit means less money to reinvest in their businesses and less demand for goods from their suppliers. The same thing applies to their vendors and at each step removed along the chain of production.
A tipping point may be reached once oil and commodity prices reach a certain level. Businesses start to cut back and search for substitutes. Individuals conserve as well. This decreased demand lowers the price of oil and commodities. In other words, there is a point at which higher oil and commodity prices also become a negative for their producers due to demand destruction.
This is all sound economic logic but it does rest on one assumption: flat revenues and incomes (including investments). If business sales and personal incomes are rising, higher oil and commodity prices can be offset without making cuts in other places.
At any rate, this analysis suggests keeping our eyes on two things as we head into 1Q earnings. First, pay close attention to the margins of companies for whom oil and other basic materials are significant inputs.
Second, we will want to be on the lookout for any top line weakness in consumer discretionary companies as a result of higher prices at the pump and for basic necessities. Two Thursdays ago, Walmart’s Head of US Operations, Bill Simon, told USA Today that
“serious inflation” is in the pipeline. General Mills, Procter & Gamble and Hershey’s have each recently announced price increases. The costs of the necessities of life are going up and that would tend to put pressure on the purveyors of discretionary items.
*****
I have not reported performance since 2Q 2010 and I am sure many of you are anxious to see how I have done of late. Here are the returns for 2010 and 1Q 2011:
1Q 2011 2010
S&P +5.42% +12.78%
DJ Total +5.62% +15.59%
Top Gun -2.55% +8.00%
I have attached two charts [Note: blog readers e-mail me for performance charts]. The first breaks down Top Gun’s performance versus the S&P and DJ Total by year.
The second is far more informative. It breaks down Top Gun’s performance versus the indexes during the bear market from July 2007 through February 2009 and during the bull market from March 2009 through March 2011. It is more informative because my macro views significantly influence how I construct the portfolios. Since I have been bearish overall during the entire period, it shows that Top Gun significantly outperformed during the bear market and significantly underperformed during the bull market:
Jul ’07- Mar ’09-
Feb ’09 Mar ’11
S&P -51.10% +80.36%
DJ Total -50.71% +87.80%
Top Gun +29.12% +9.25%
Since Inception (Jan 1, 2007 – Mar 31, 2011) performance is still quite good:
S&P: -6.52%
DJ Total: -1.26%
Top Gun: +47.00%
NOW IS THE TIME TO INVEST WITH TOP GUN: If you have been thinking about investing with Top Gun, now is a good time to give me a call or shoot me an e-mail.
Greg Feirman
Founder & CEO
A Registered Investment Advisor
9700 Village Center Dr. #50H
Granite Bay CA 95746
(916) 224-0113
CALL NOW FOR A FREE CONSULTATION BY PHONE OR IN PERSON!

