Is The Bubble Popping?
Note: To sign up to be alerted when the morning blog is posted to my website, enter your name and email in the box in the right hand corner titled “New Post Announcements”. That will add you to my AWeber list. Each email from AWeber has a link at the bottom to “Unsubscribe” making it easy to do so should you no longer wish to receive the emails.
There is a debate among economists about whether we are on the verge of one of the greatest economic booms in history or whether the current market rally is the bubble of all bubbles. The consensus view reflected in market prices is the former. The latter is the correct one in my opinion…
It is no surprise that such a large infusion of newly created money into the financial system should result in a massive increase in prices. And, in fact, that is what has primarily caused the boom in financial markets we have experienced since the March 2020 lows, not the beginning of an economic boom based on economic fundamentals…
The problem with this is that the boom in financial markets we are experiencing is, therefore, a mirage. It is not the result of real economic growth. And it cannot last. That’s because it is going to result in nasty side effects, like most powerful drugs. In this case, that side effect will be inflation. In fact, inflation is already here and will only accelerate with economic reopening.
– “Boom or Bubble?”, Top Gun Financial, April 27, 2021
Macro and Fundamental Analysis tells you what’s going on in the world. Technical Analysis tells you what’s going on in financial markets which is a reflection of perception and sentiment, not fundamental reality.
Sometimes the two diverge when market participants perception of reality becomes distorted. In those instances, we can make a lot of money from what the great Michael Steinhardt called Variant Perception, a perception that is at odds with the consensus view being priced into markets.
The issue when fighting the market is always timing. As the great John Maynard Keynes famously said: “The market can stay irrational longer than you can stay solvent.” That’s where Technical Analysis comes in: It can help us spot the inflection points in market psychology.
For a long time now, I’ve argued that the move off the March 2020 COVID Lows has been driven primarily by global central bank liquidity creating a bubble that would inevitably pop.
The question was: When? Technical Analysis is suggesting to me once again the answer might be Now.
The first and by far most important metric in Technical Analysis is simply Price. Ultimately, we want to be long stuff that’s going up and short stuff that’s going down. Pretty obvious.
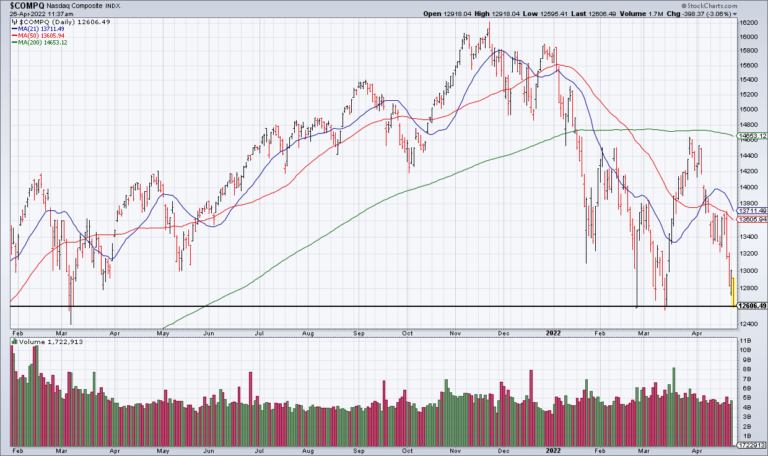
Take a look at my 15 month chart of the NASDAQ above. As you can see, the NASDAQ hasn’t made any progress since the February Highs and the 50 DMA seems to be acting as resistance at the moment.
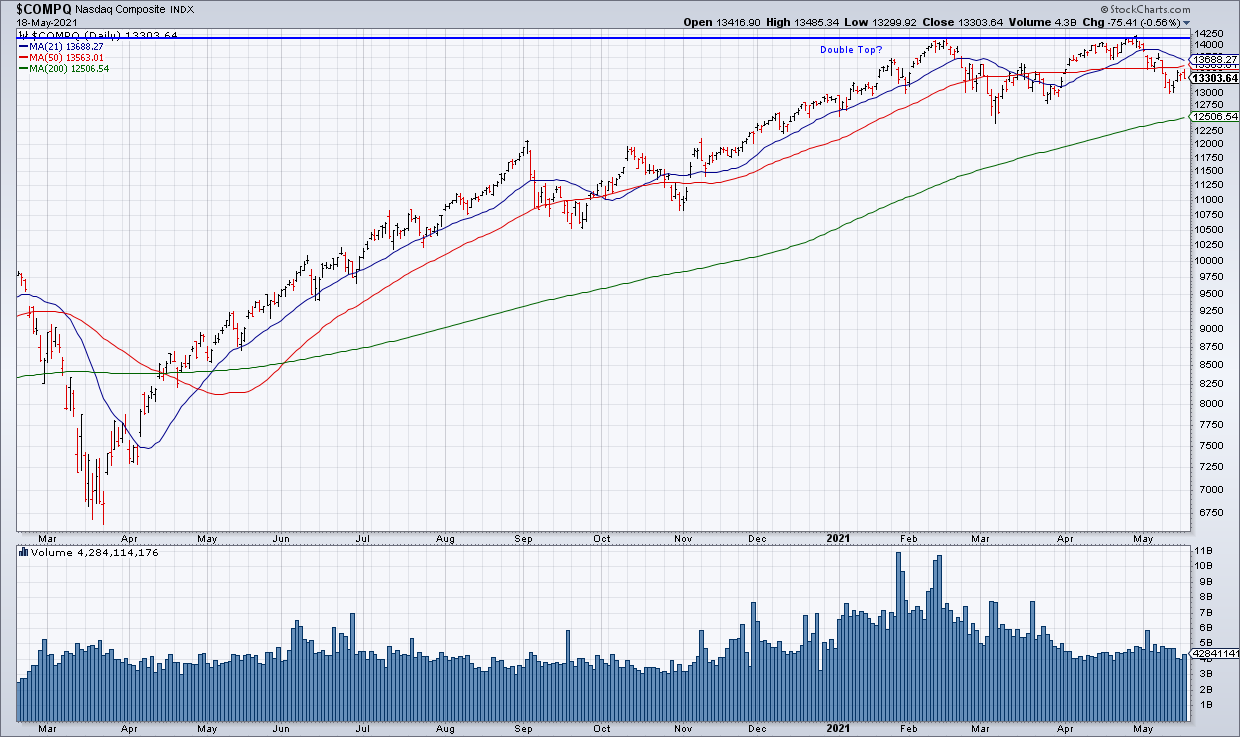
I am not sure what moving average the red line in the weekly chart of the QQQ above by the excellent technician Gregory Krupinski represents but it also seems to be acting as resistance and Krupinski clearly thinks it’s significant.
After Price, there are a number of other “internals” in Technical Analysis that can help us better understand market sentiment. Take a look at the two charts in the tweet above from the excellent technician Mark Ungewitter. I don’t know how exactly the z-score for tech allocation is calculated but the first chart shows that, based on that measure, allocations to Tech among fund managers in B of A’s monthly survey are at an all time low. The second chart shows the NASDAQ’s Relative Strength compared with the S&P breaking down below the previous lows at the end of 2018. In other words, institutional investors are moving out of Tech and that is now starting to make itself felt in the NASDAQ’s performance.
Take a look at the two charts in the tweets above from the excellent technician Willie Delwiche. The first chart shows that trading volume on the NASDAQ has dropped 20% since March. The second chart shows that equity call volume has decline about 15% from the February peak. I can’t say it better than Delwiche: “Looks like speculative unwind is still ongoing”.
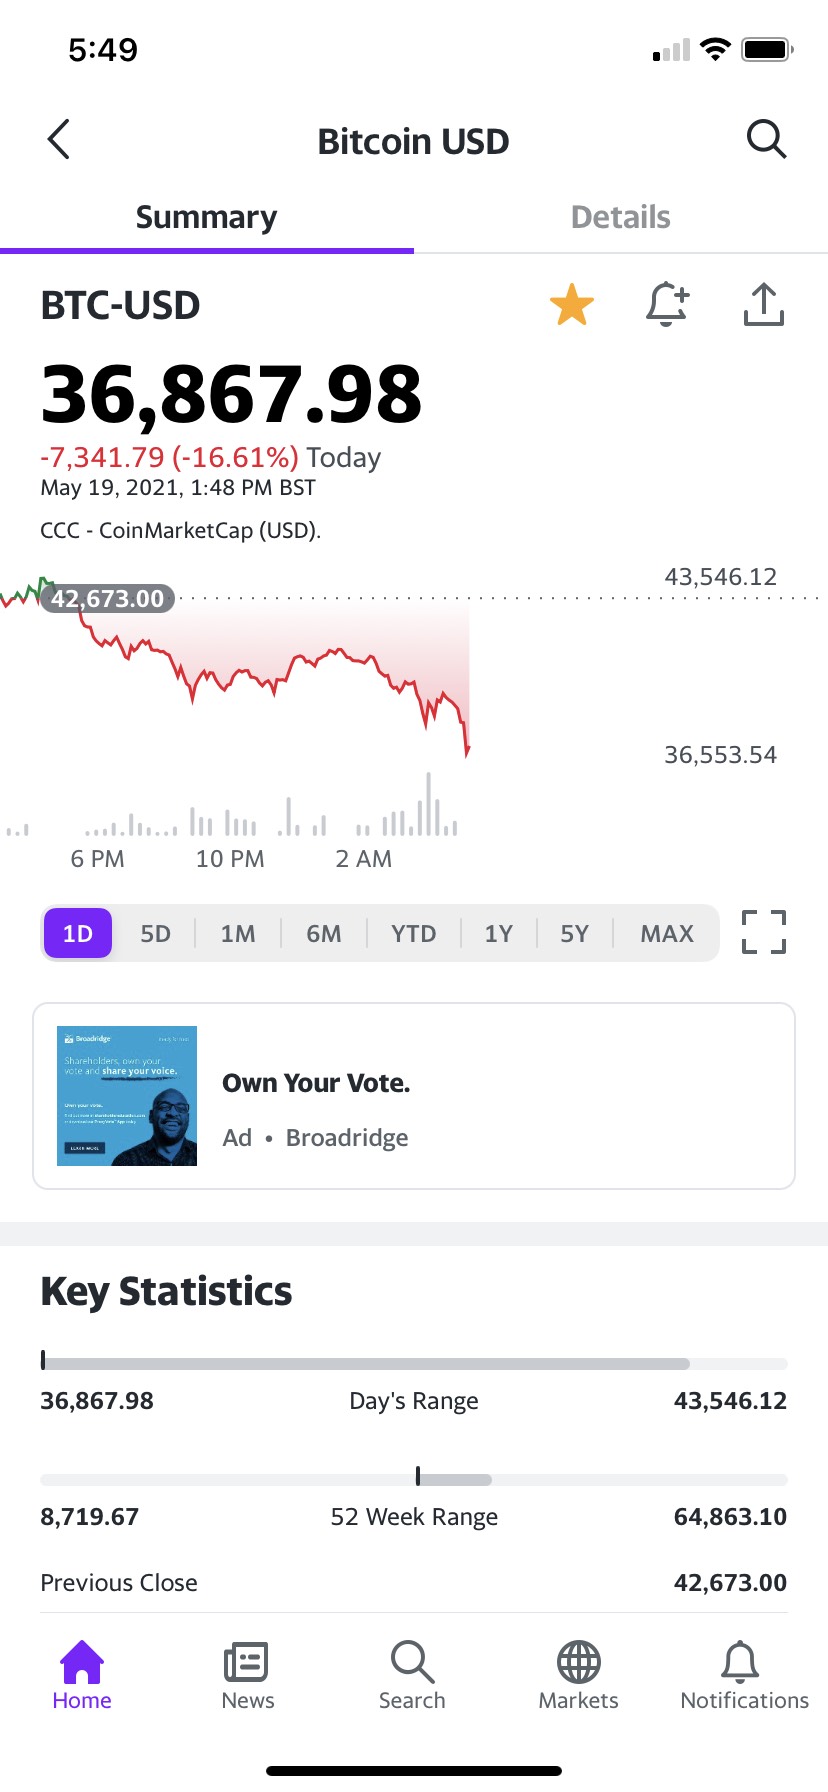

A great measure of Risk Appetite in my opinion is the performance of crypto. Crypto had been crushing it but started to fall apart hard over the weekend. Overnight we have had another crash with significant technical levels being taken out.
As Sven Henrich points out, the correlation between stock and crypto prices is extremely high. It’s no surprise therefore that the S&P Futures are currently off ~1% and the NASDAQ Futures ~1.5%.
My only concern about looking for a spot to short Tech here is The Fed. Let’s see if our friends try to lend a helping hand today.