Is The Market Too Strong?, WMT & HD Earnings, Copper & Bitcoin
Note: A few months ago I started writing a daily morning market email for clients, friends and family. I recently decided to start making this email more broadly available. Email me at gfeirman@topgunfp.com if you’d like to be added to the list.
Is it possible to have TOO many stocks supporting the market?
I believe the answer is yes, just like candy….. too much of a good thing can sometimes be bad.
We’re now at the point where almost all stocks are back above the 200 DMA…. At some point it gets to be that there’s few stocks left to flip from downtrends to uptrends, acting as a propellent to send the market higher.
Rarely do we have 5 [S&P] sectors with more than 90% of their stocks above the 200 DMA. The last time this occurred was after the mini melt up in January 2018 and before that it’s occurred just 3 times since 2011. Each of these periods, where metaphorically everyone had already “jumped in the pool”, left little catalyst to give the market its next leg up and instead we saw varying degrees of weakness – Andrew Thrasher, CMT, “Can You Have Too Much of a Good Thing?” (https://www.athrasher.com/can-you-have-too-much-of-a-good-thing/), November 17, 2020
Every afternoon, I read The Chart Report, which includes 10 of the best tweets, almost all with charts, on Technical Analysis as well as links to some of the best blog posts and video content on technical analysis from the day. It’s become almost as indispensable to me as reading The Wall Street Journal every morning. For those of you who believe in Technical Analysis, I can’t recommend it highly enough. Reading it yesterday afternoon, I came across a brilliant blog post by Andrew Thrasher from which I have quoted liberally above and which I will now proceed to analyze.
Technicians measure the trend and how strong or weak it is. In general, they like strong uptrends. But Thrasher asks a question that I’ve never seen asked before: Can an uptrend be too strong? And he has shown, counterintuitively, that one can. As of the close on Monday November 16, five sectors of the S&P had more than 90% of their components above their 200 DMAs. That has only happened on four previous occasions since 2011 and has been followed by corrections every time.
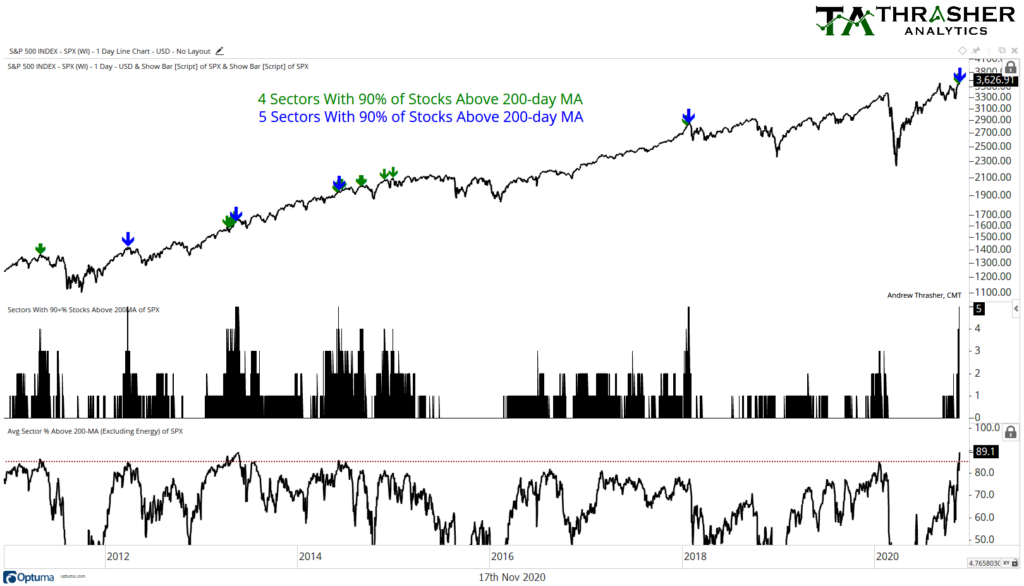
I highly recommend taking a close look at the five blue arrows on Thrasher’s chart representing these five occurrences. Three of the four previous occasions appear to have come just days before market corrections while the fourth, in early 2014, preceded a correction by slightly longer. If recent history is any guide, the market is due for a correction very, very soon.
That’s why I didn’t put on the IWM & EWJ trade I wrote about yesterday morning. I wanted to buy into weakness but yesterday’s weakness was shallow and lasted only the first 30 minutes of the session. Neither ETF corrected deeply enough or for long enough for me to want to put on the trade. So I sat on my hands.
Making short term market forecasts is extremely dicey but I have a roadmap into year end. With 6 data light weeks left in the year after this week, two of them holiday shortened, I believe that we’ll see an imminent 3-5% correction before rallying into year end on the euphoria over a #COVIDVaccine and a 2021 #ReOpen
My plan is to buy IWM & EWJ into that correction for a trade through year end. I have selected those two ETFs to capitalize on the #ReOpen #Rotation trade into #Value catalyzed by Pfizer’s #COVIDVaccine announcement last Monday. I believe they will outperform the SPY and QQQ.
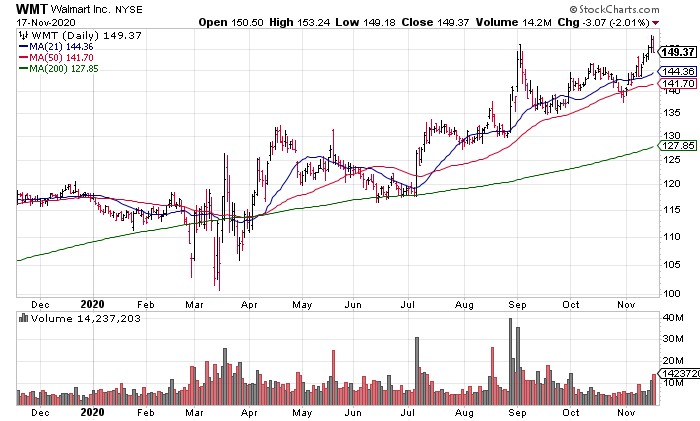
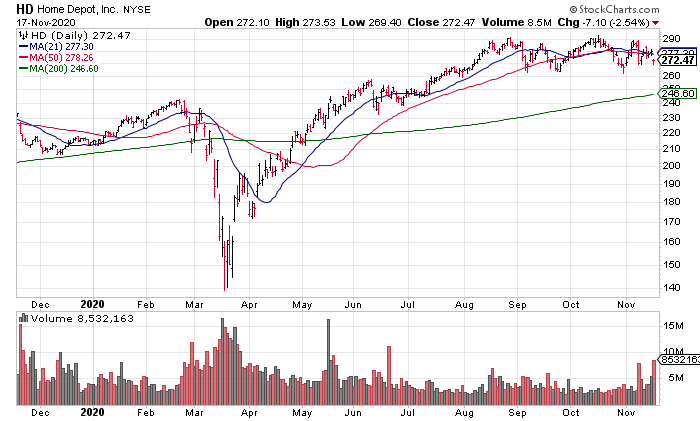
Next, I want to discuss earnings from yesterday (Tuesday) morning by Walmart (WMT) and Home Depot (HD). Both of these stocks have been on fire since the pandemic as it has turbo charged their businesses.
Let’s start with WMT. WMT reported another scorching quarter. Walmart US Comps – Excluding Fuel were +6.4% for the quarter ended 10/31/20. Adjusted Operating Margins expanded from 3.9% a year ago to 4.3% leading to a 16% increase in EPS to $1.34. So why did the stock fall 2.01% yesterday? Because when a stock runs up like that into an earnings report and is trading at such a high valuation, a great, not merely very good, report is needed to propel it higher.
The same thing happened with HD for its fiscal year 3rd quarter ended 11/1/20.. US Comps were up a ridiculous 24.6% leading to a 26% increase in EPS to $3.18 and yet the shares sold off 2.54%. Again, the stock was just too hot and the valuation too high. Another way of saying this is that all the good news was #PricedIn
Before leaving this section, I want to point out how it supports the argument of the previous section. Despite reporting great numbers, both WMT and HD sold off yesterday because the good news was already #PricedIn With 87% of S&P stocks above their 200 DMAs (Thrasher), the same thing can be said of the entire market.
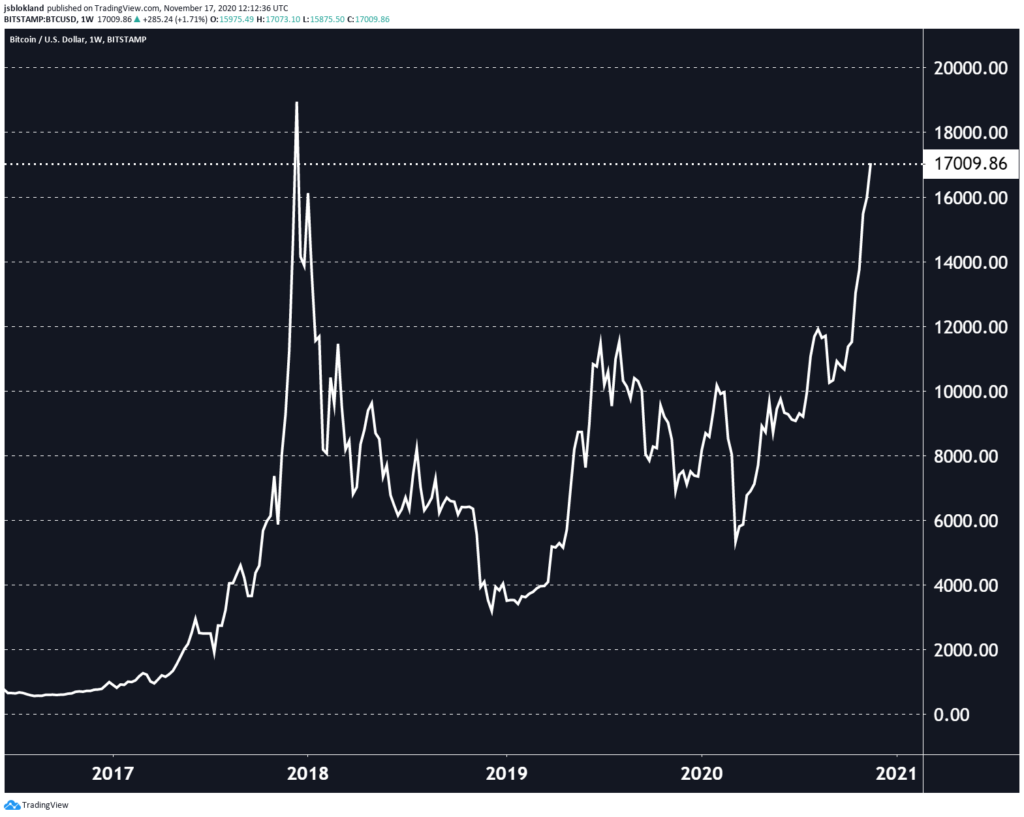
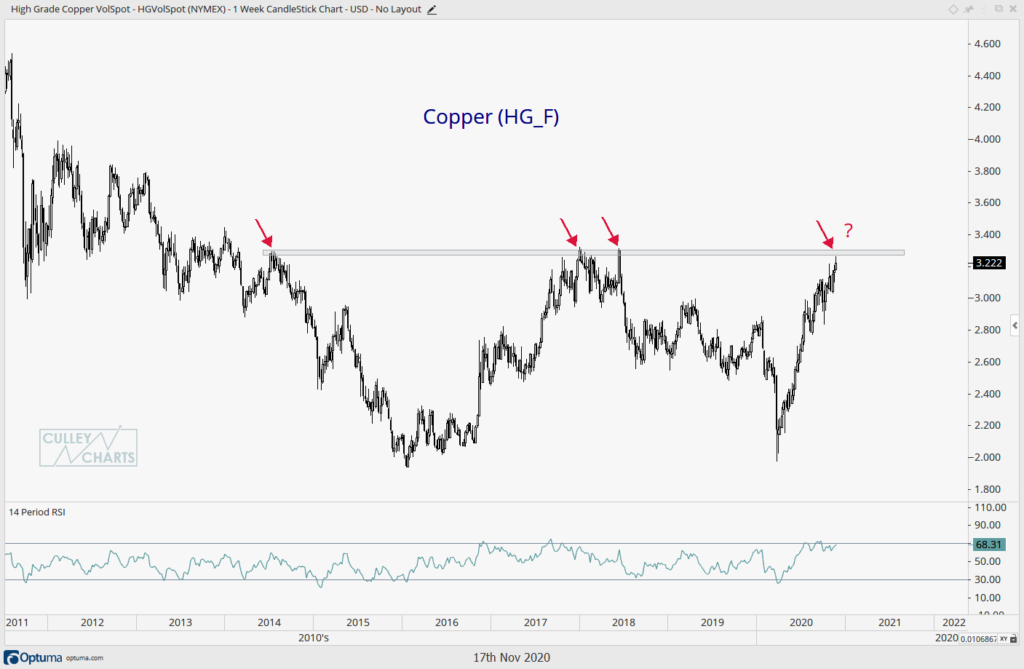
Lastly, let me briefly mention copper and Bitcoin.
First, copper, the metal with a Phd in Economics because demand for it correlates with economic strength, is at a level that has served as resistance for 7 years. A breakout would get technicians even more bullish that a roaring economic recovery is in the works.
Second, Bitcoin has cleared $18k tonight, making Jeroen Blokland’s Bitcoin $17k chart from yesterday outdated already, and is almost certainly on its way to a test of its December 2017 high near $20k.