Market Commentary, Extreme Sentiment & Breadth, Bitcoin $19k & a Shoutout to The Chart Report
Note: To sign up to be alerted when the morning email is posted to my website, enter your name and email in the box in the right hand corner titled “New Post Announcements”. That will add you to my AWeber list. Each email from AWeber has a link at the bottom to “Unsubscribe” making it easy to do so should you no longer choose to receive the emails.
The market has caught fire this week. After a solid Monday (only the Russell 2000 was very strong at +1.85%), everything was up yesterday:
S&P +1.62% NASDAQ +1.31% Russell +1.94%
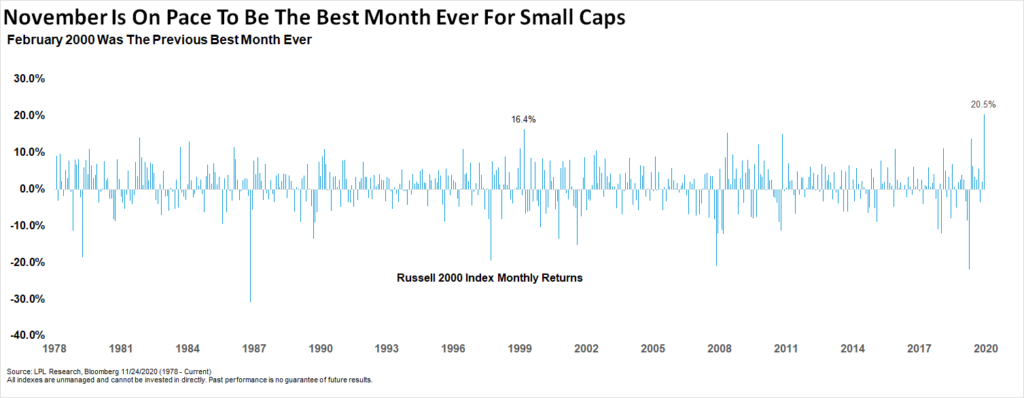
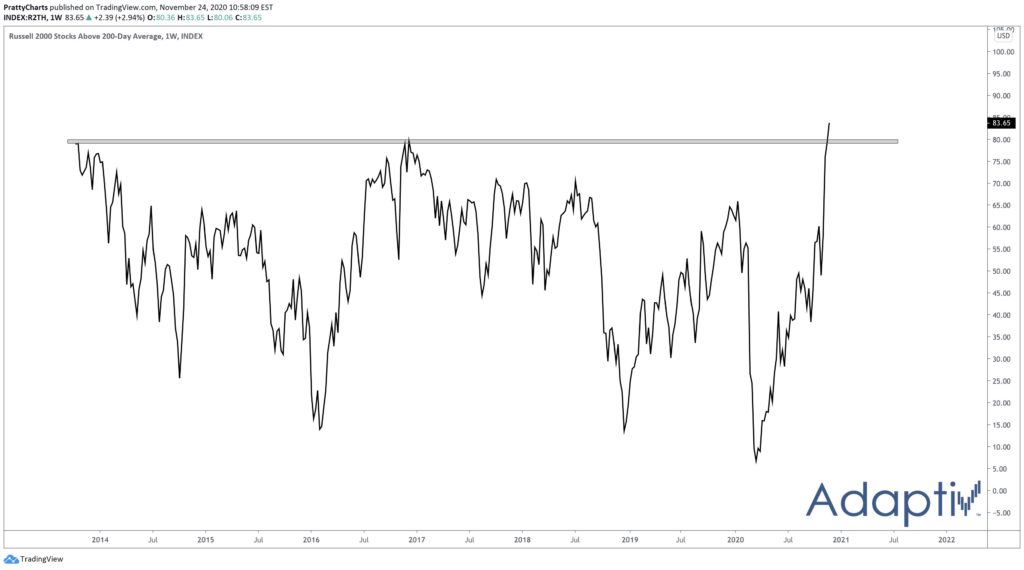
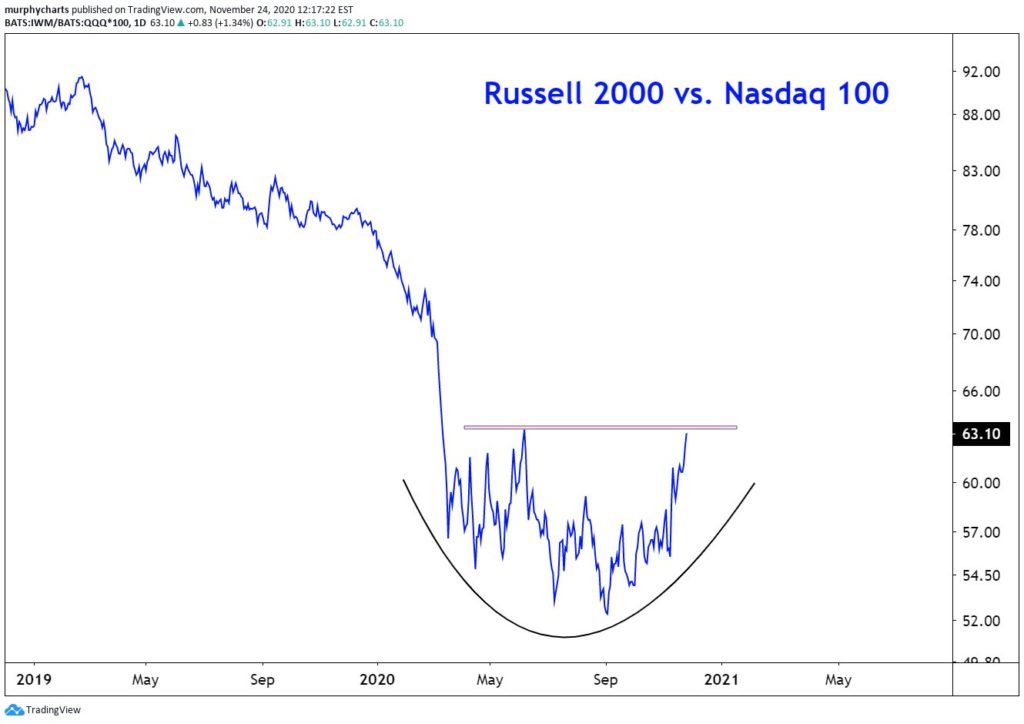
We now sit right on the verge of a breakout to new ATHs for the S&P and NASDAQ while the Russell is making new ATHs almost everyday. In fact, the Russell is +20.5% through Tuesday (11/24), its best month ever according to Ryan Detrick (Chart Source: Twitter: @RyanDetrick). More than 80% of its components are above their 200 DMAs, the most since at least 2014 (Chart Source: Twitter: @PrattyCharts). And while the S&P and NASDAQ had excellent days yesterday, the #Rotation trade is still on in full force as investors continue to rotate from #StayAtHome #PandemicBenificiary stocks into #ReOpen names (Chart Source: Twitter: @murphycharts).
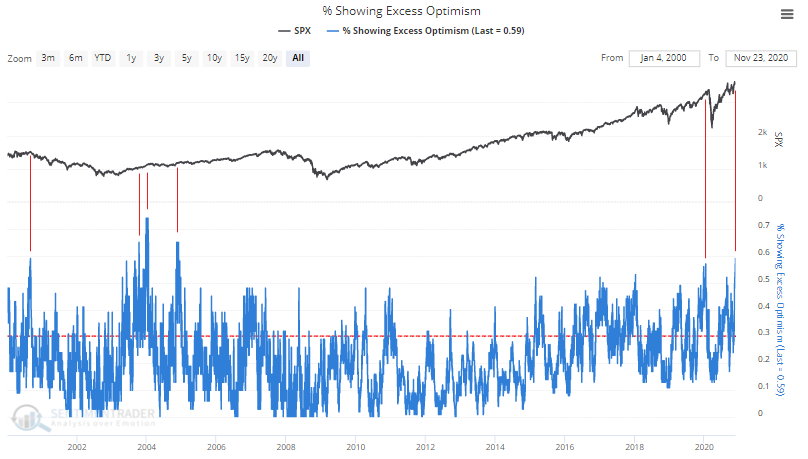
That’s what’s happening in terms of price. Now I want to discuss an excellent blog post from Sentiment Trader’s Troy Bombardia on extreme sentiment and breadth, known in technical analysis as internals (“Once in a Blue Moon Sentiment and Breadth, Bombardia, 11/24: https://sentimentrader.com/blog/once-in-a-blue-moon-sentiment-and-breadth–24-11-2020/). 59% of Sentiment Trader’s sentiment indicators are showing excess optimism right now, a 15 year high. As I wrote yesterday mornings, the vaccines news and the breakout in the Russell 2000 has gotten everyone all bulled up. Since 1998, this kind of extreme sentiment has always led to months of chop, pullback or even crashes.
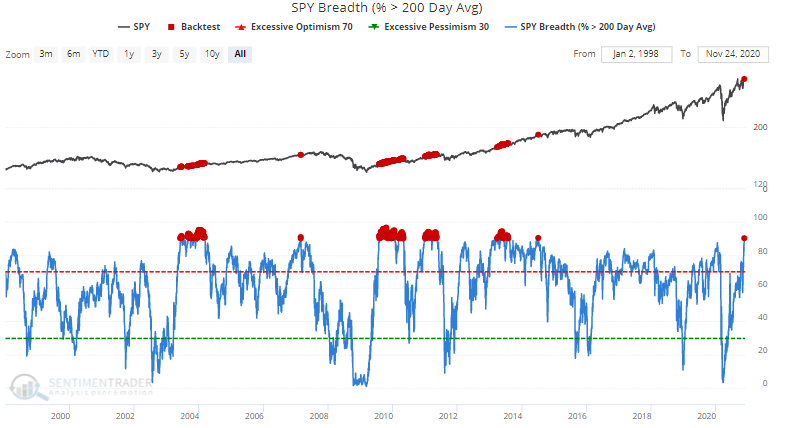
Although we have been covering this quite a bit in the morning email, Bombardia also points out that breadth is also extreme. For example, 90% of S&P components are above their 200 DMAs. While the sentiment readings are short to medium term bearish according to Bombardia, the breadth readings have been unambiguously bullish since 1998 with the S&P being up 99% of the time 1 year later. Bombardia concludes:
The two narratives can coexist if we consider two different time frames. While unimaginably high sentiment can and usually does lead to short term losses and volatility, incredibly strong breadth is more of a long term bullish sign for stocks.
It’s hard to argue with 99% but I’m going to. While Bombardia’s data shows the incredibly strong breadth to be bullish one year out since 1998, I think it’s one more sign of a blow off top this time around, in conjunction with sentiment, valuation and macro considerations. To be blunt: There is a bubble and it’s close to popping.
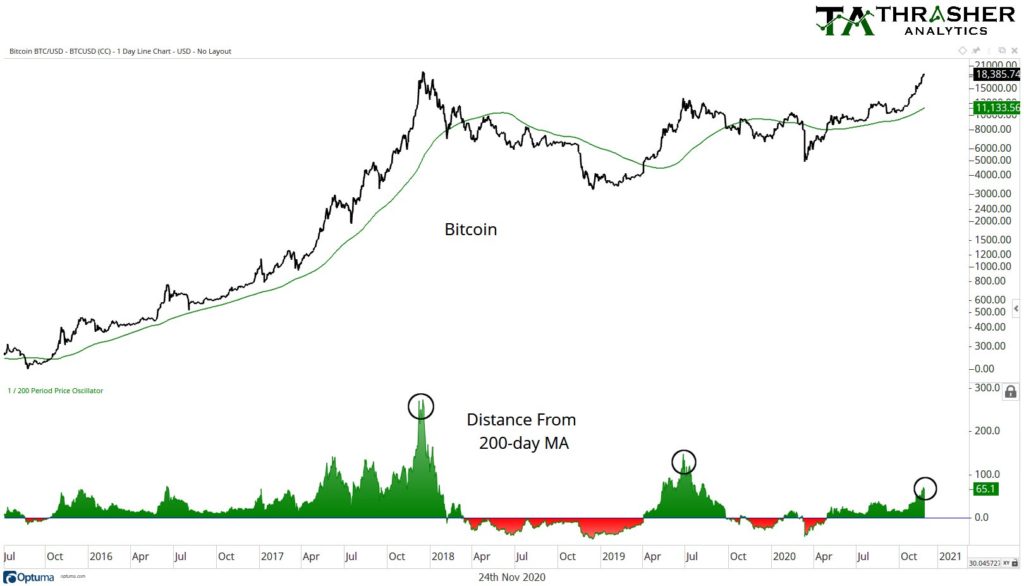
Lastly, a few loose ends. Bitcoin has surpassed $19k and clearly has a date with its December 2017 ATHs just below 20k (Chart Source: Twitter: @AndrewThrasher).
Finally, I simply must give a shoutout to Patrick Dunuwila, the creator of The Chart Report. All six charts in this email are from Tuesday’s The Chart Report and I found Bombardia’s blog post from it as well. I have three essential sources in my daily market analysis routine: corporate earnings reports (Fundamental Analysis), The Wall Street Journal (News and Fundamental Analysis) and The Chart Report (Technical Analysis). You know you’re in good company when a fundamentally oriented trader like me puts you on a par with the hard fundamental data of corporate earnings reports and what I believe to be the greatest newspaper in history. You’re killing it Patrick! Add The Chart Report to your daily market routine folks. It’s that good.