Strong Seasonality / Earnings Week of 11/30, Analyzing November
Note: To sign up to be alerted when the morning email is posted to my website, enter your name and email in the box in the right hand corner titled “New Post Announcements”. That will add you to my AWeber list. Each email from AWeber has a link at the bottom to “Unsubscribe” making it easy to do so should you no longer choose to receive the emails.
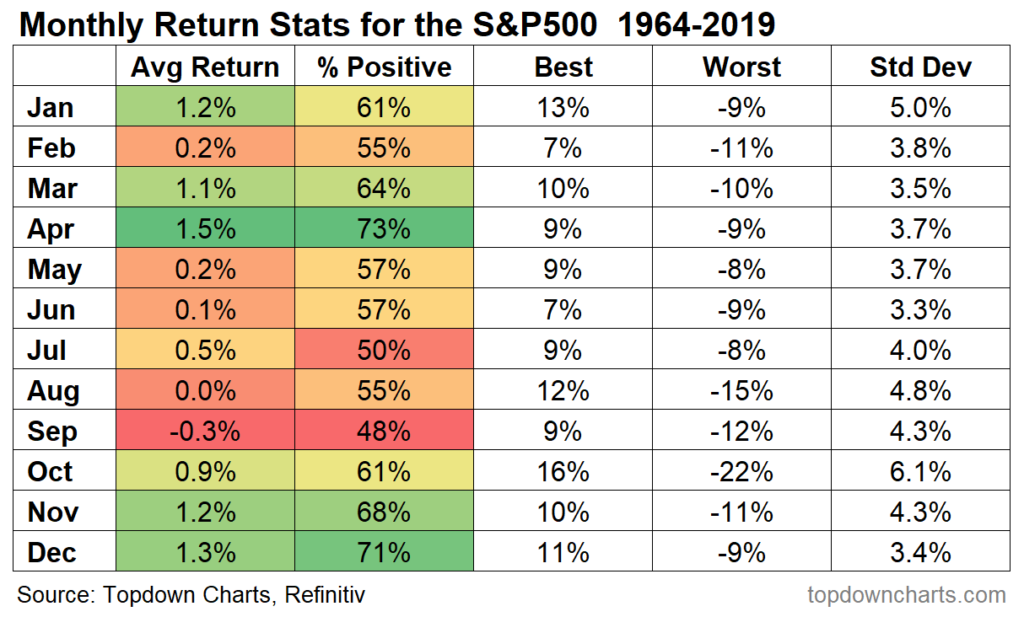
The first thing to know is that December, which begins on Tuesday, has been the second best month for the S&P since 1964. It has been positive 71% of the time since 1964 with an average gain of 1.3%.
Investors have become uninterested in worrying about downside risks – Tobias Levkovich, Chief US Equity Strategist, Citigroup, quoted in Ben Levisohn, The Trader Column, Barron’s, November 27
However, I am not sure it will be a great month this year because of how strong November has been. According to Ben Levishohn in yesterday’s The Trader Column in Barron’s, the S&P was +11%, the NASDAQ +12% and the Russell +20% in November. Stocks don’t go straight up. My feeling is that December’s strong seasonality has been pulled forward by the huge moves we saw in November.
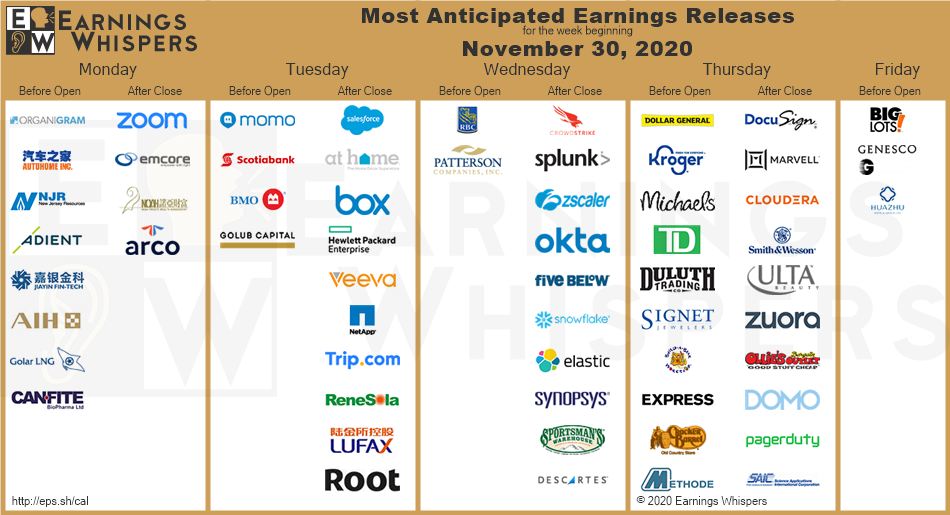
There are actually a number of significant earnings reports next week. Zoom (ZM) reports on Monday afternoon, Salesforce (CRM) Tuesday afternoon, Kroger (KR) Thursday morning and Ulta Beauty (ULTA) Thursday afternoon.
Now that we’ve set the stage for next week and December, let’s review what happened in the historic month of November 2020.
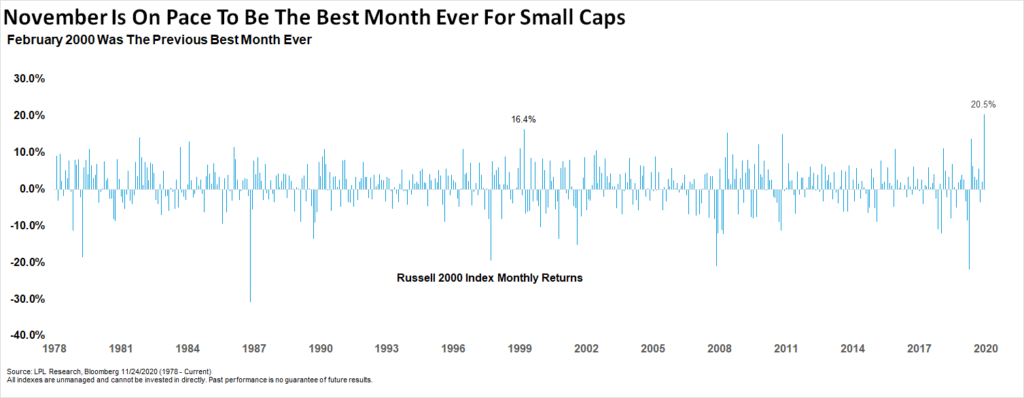
The key events of November were the announcement of the effectiveness of COVID vaccines from Pfizer (Monday, November 9) and Moderna (Monday, November 16). These announcements catalyzed a radical rotation in the market out of the stay at home, pandemic beneficiary stocks, many of them tech stocks well represented by the QQQ (NASDAQ-100 ETF), into reopen, real economy stocks that skew value and are well represented by the IWM (Russell 2000 ETF). According to Ryan Detrick of LPL Financial, the Russell 2000 was +20.5% through Tuesday, November 24th, and is on pace for its best month ever.
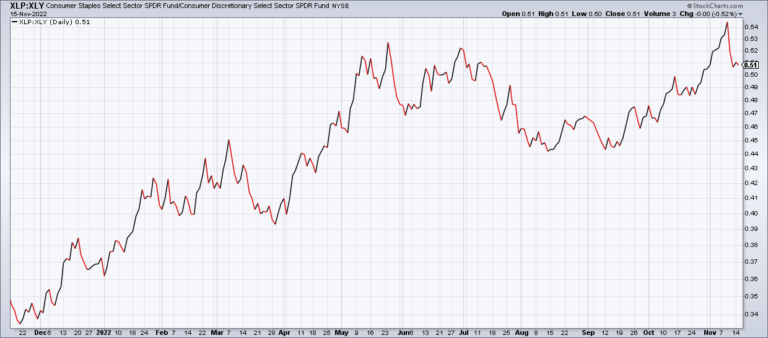
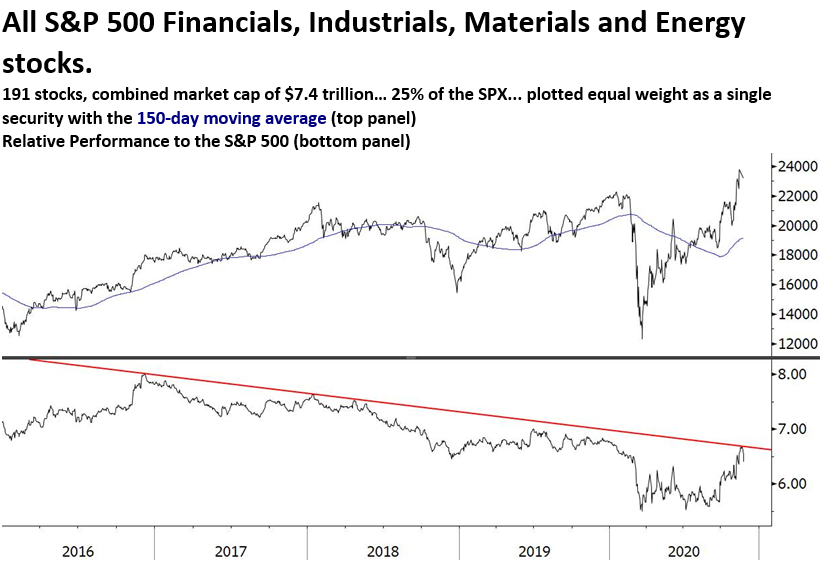
The great technician Carter Worth put up a chart on Twitter on Wednesday, November 25 showing the relative performance of the S&P Financial, Industrial, Material and Energy sectors, also a good proxy for reopen stocks, to the the S&P 500. If you look at the bottom chart, you can see that this basket of equal weighted stocks hit a downtrend line versus the S&P from late 2016 at which it failed. Worth’s conclusion is that the rotation trade is now to be faded: “Conclusion: Fade the collective move in Financials, Industrials, Materials and Energy” (https://twitter.com/CarterBWorth/status/1331635784949133315?s=20).
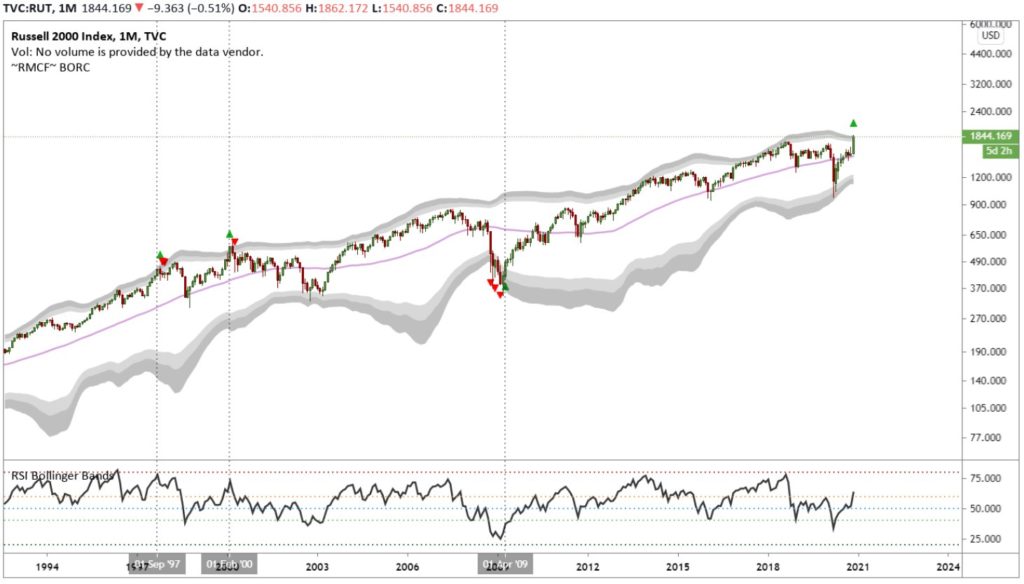
The best chart I saw last week was from @SoccerMomTrades which showed the Russell 2000 making a 3 standard deviation move in November. That has only happened 3 other times since 1994 – Sep97, Feb00 and Apr09 – the latter two of which were the top of the Dot Com Bubble and the bottom of the Great Recession. This suggests to me that November’s move in the Russell may have been a blow off top marking the end of this bull market. This is in line with Carter Worth’s analysis as well.
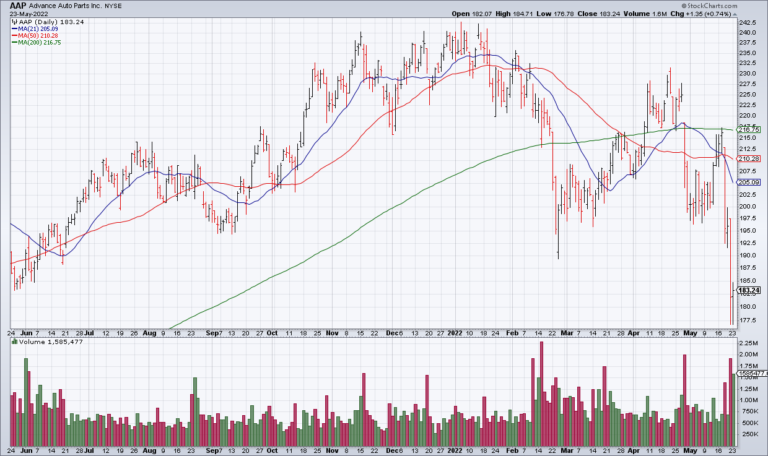
Along with a potential blow off top type of move in reopen, real economy, value stocks, Big Tech is consolidating, mostly well below their 52 week highs from September 2. The chart’s author, Gregory Krupinski, commented: “All consolidating within uptrends. Obviously, the way these break will have big impacts” ((Gregory Krupinski, Twitter, November 25, 1:45pm PST: (https://twitter.com/G_krupins/status/1331715584946548740?s=20)).
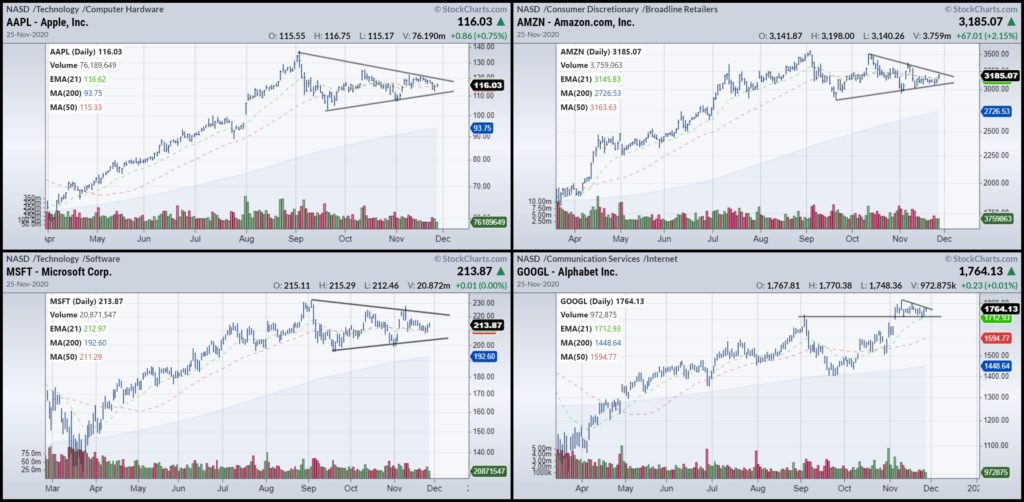
A blow off top type of move in value combined with a breakdown in the four biggest stocks in the world would inevitably mean the end of the bull market.
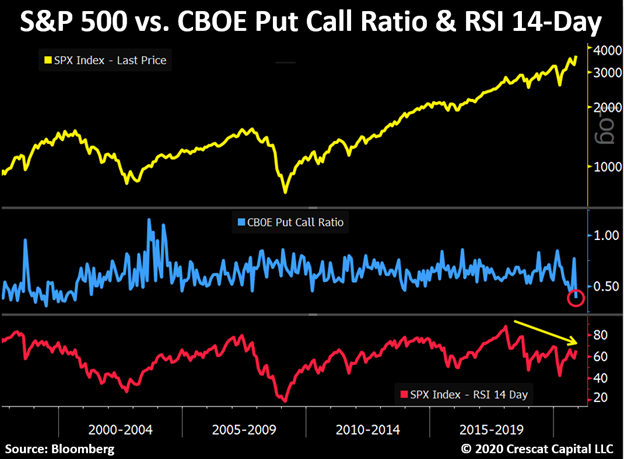
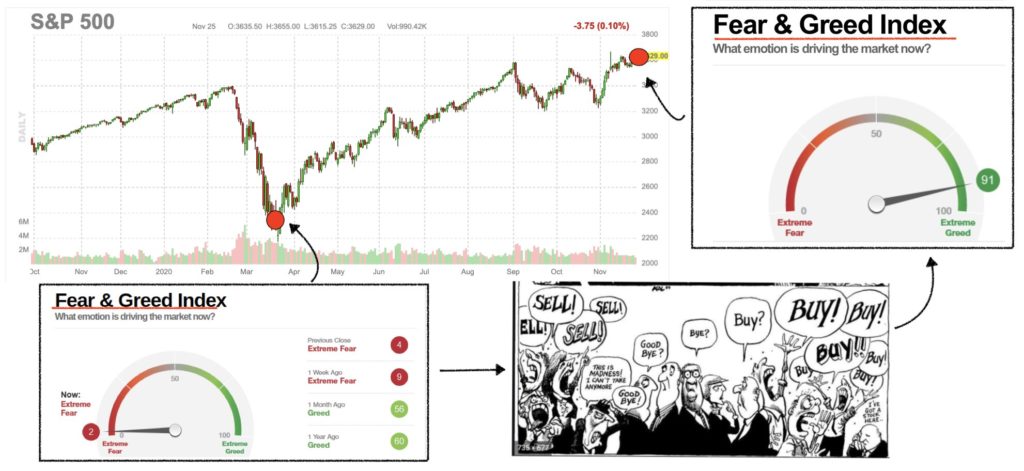
And it’s not just the price action that has gotten extreme in November. Sentiment has become historically bullish. The Put to Call ratio on S&P stocks has dropped to historic lows as investors shun insurance (puts) in favor of leveraged long bets (calls). Arun Chopra has a beautiful chart illustrating the shift from extreme fear in March to extreme greed in November.
I’ve already discussed extreme breadth and extreme overvaluation in recent morning emails so I’m not going to discuss them here but they are part of the overall mosaic as well.
In conclusion, while the crowd is becoming mega bullish ahead of the COVID vaccines and a 2021 reopen, measures of price action, sentiment, breadth and valuation are at historic extremes, the type of extremes you see at major market inflection points. Paradoxically, the market can top when things look best as all of the good news is priced in. I think this is a time to be very cautious, not put on additional risk like the crowd.