Timing The Top, Shorts Are Different From Longs, TSLA, GS JPM BAC Breaking Out
Note: To sign up to be alerted when the morning blog is posted to my website, enter your name and email in the box in the right hand corner titled “New Post Announcements”. That will add you to my AWeber list. Each email from AWeber has a link at the bottom to “Unsubscribe” making it easy to do so should you no longer wish to receive the emails.
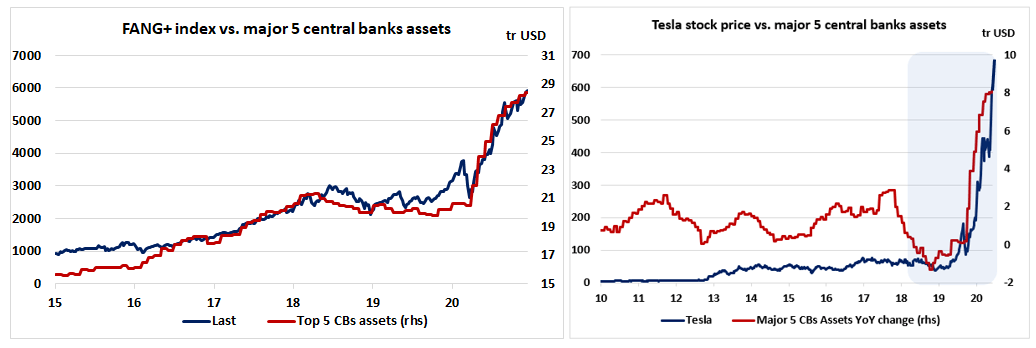
Even though some ratios and indicators are showing that the S&P 500 looks currently extremely ‘overbought’ relative to its fundamentals, investors must not ignore the power of liquidity. After rising by a steady pace of $1.25 trillion in the past 12 years preceding the pandemic, assets of the 5 major central banks (Fed, ECB, BoJ, PBoc, BoE) have surged by $8 trillion this year and are expected to grow by another $5 trillion in the coming two years up to $33 trillion – Rothko Research, “S&P 500: Another Bull Year Ahead And A Peak Probably Priced For Early 2022”, SeekingAlpha, Monday December 21, 2020
I am very happy to have discovered Rothko Research a couple weeks ago. These guys understand exactly what is going on – unprecedented CB liquidity has driven asset prices to stupendous heights disconnected from economic fundamentals – but, in contrast to me, believe it can continue for another year before a top in early 2022.
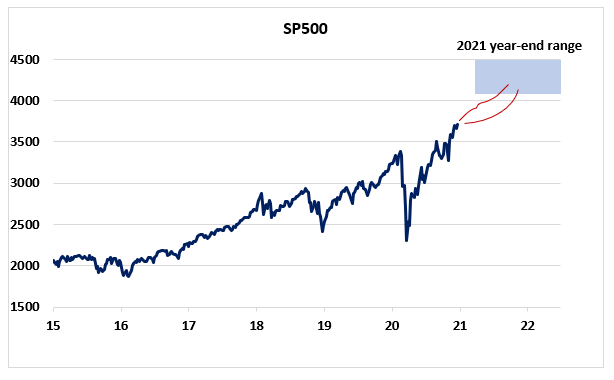
In the comments section to the article I just quoted from, Rothko says their 2021 S&P 500 price target is 4,200 – about 14% higher from Monday’s close (3,695). Based on extreme technicals, sentiment and valuation, I have been arguing that the top is in the process of being formed now, likely in the 1Q21. However, Rothko understood what was going on as early as April of this year – that price would disconnect from fundamentals for a while – while I had a bit of a debacle trying to short a market Jeremy Grantham characterized as “The Great Disconnect”. Therefore, Rothko’s analysis deserves to be taken seriously.
However, it’s worth pointing out that their argument for another year of this madness and a top a year from now doesn’t amount to much more than that central banks will continue to be loose going forward. My argument is that CBs pace is slowing down and all the good news about the vaccine, reopening and normalization is more than priced in. Again, this is not a precise argument for why the market will top in 1Q21.
The reason our arguments are so weak is that market timing is almost all art and little science. There is no technical indicator, and there are a lot of esoteric ones (Coppock, McCellan Oscillator, Fibonacci Extensions etc..), that can tell you for sure when the top or bottom of the market or stock is in. There are a conjunction of phenomena that lead to major turning points in the market and identifying them requires integrating the various inputs but is still more art than science. In the end, what we do know is that this market is a massive bubble; what we don’t know is when it’s going to end (“The market can stay irrational longer than you can stay solvent” – John Maynard Keynes).
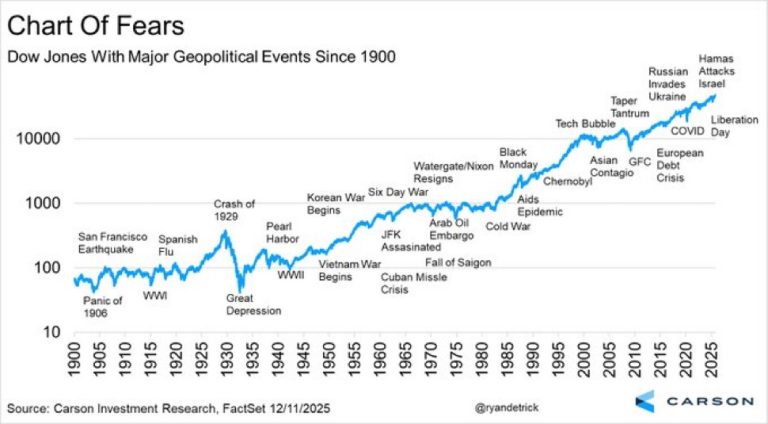
Next, I want to discuss shorting. First, shorting is generally a losing strategy because the market has been trending up for more than 100 years now. Look at a long term chart of the indexes and what you see is a relentless march higher with pauses in the 1930s and 1970s and small downward blips in 1907, 1929, 1987, 2000 and 2008 (see Top Gun Financial, “To Short Or Not To Short”, Section 3, November 20, 2020). This is not something you generally want to fight. However, this may be a special situation (see Top Gun Financial, “The Shorting Opportunity of a Lifetime”, Section 3, December 7, 2020).
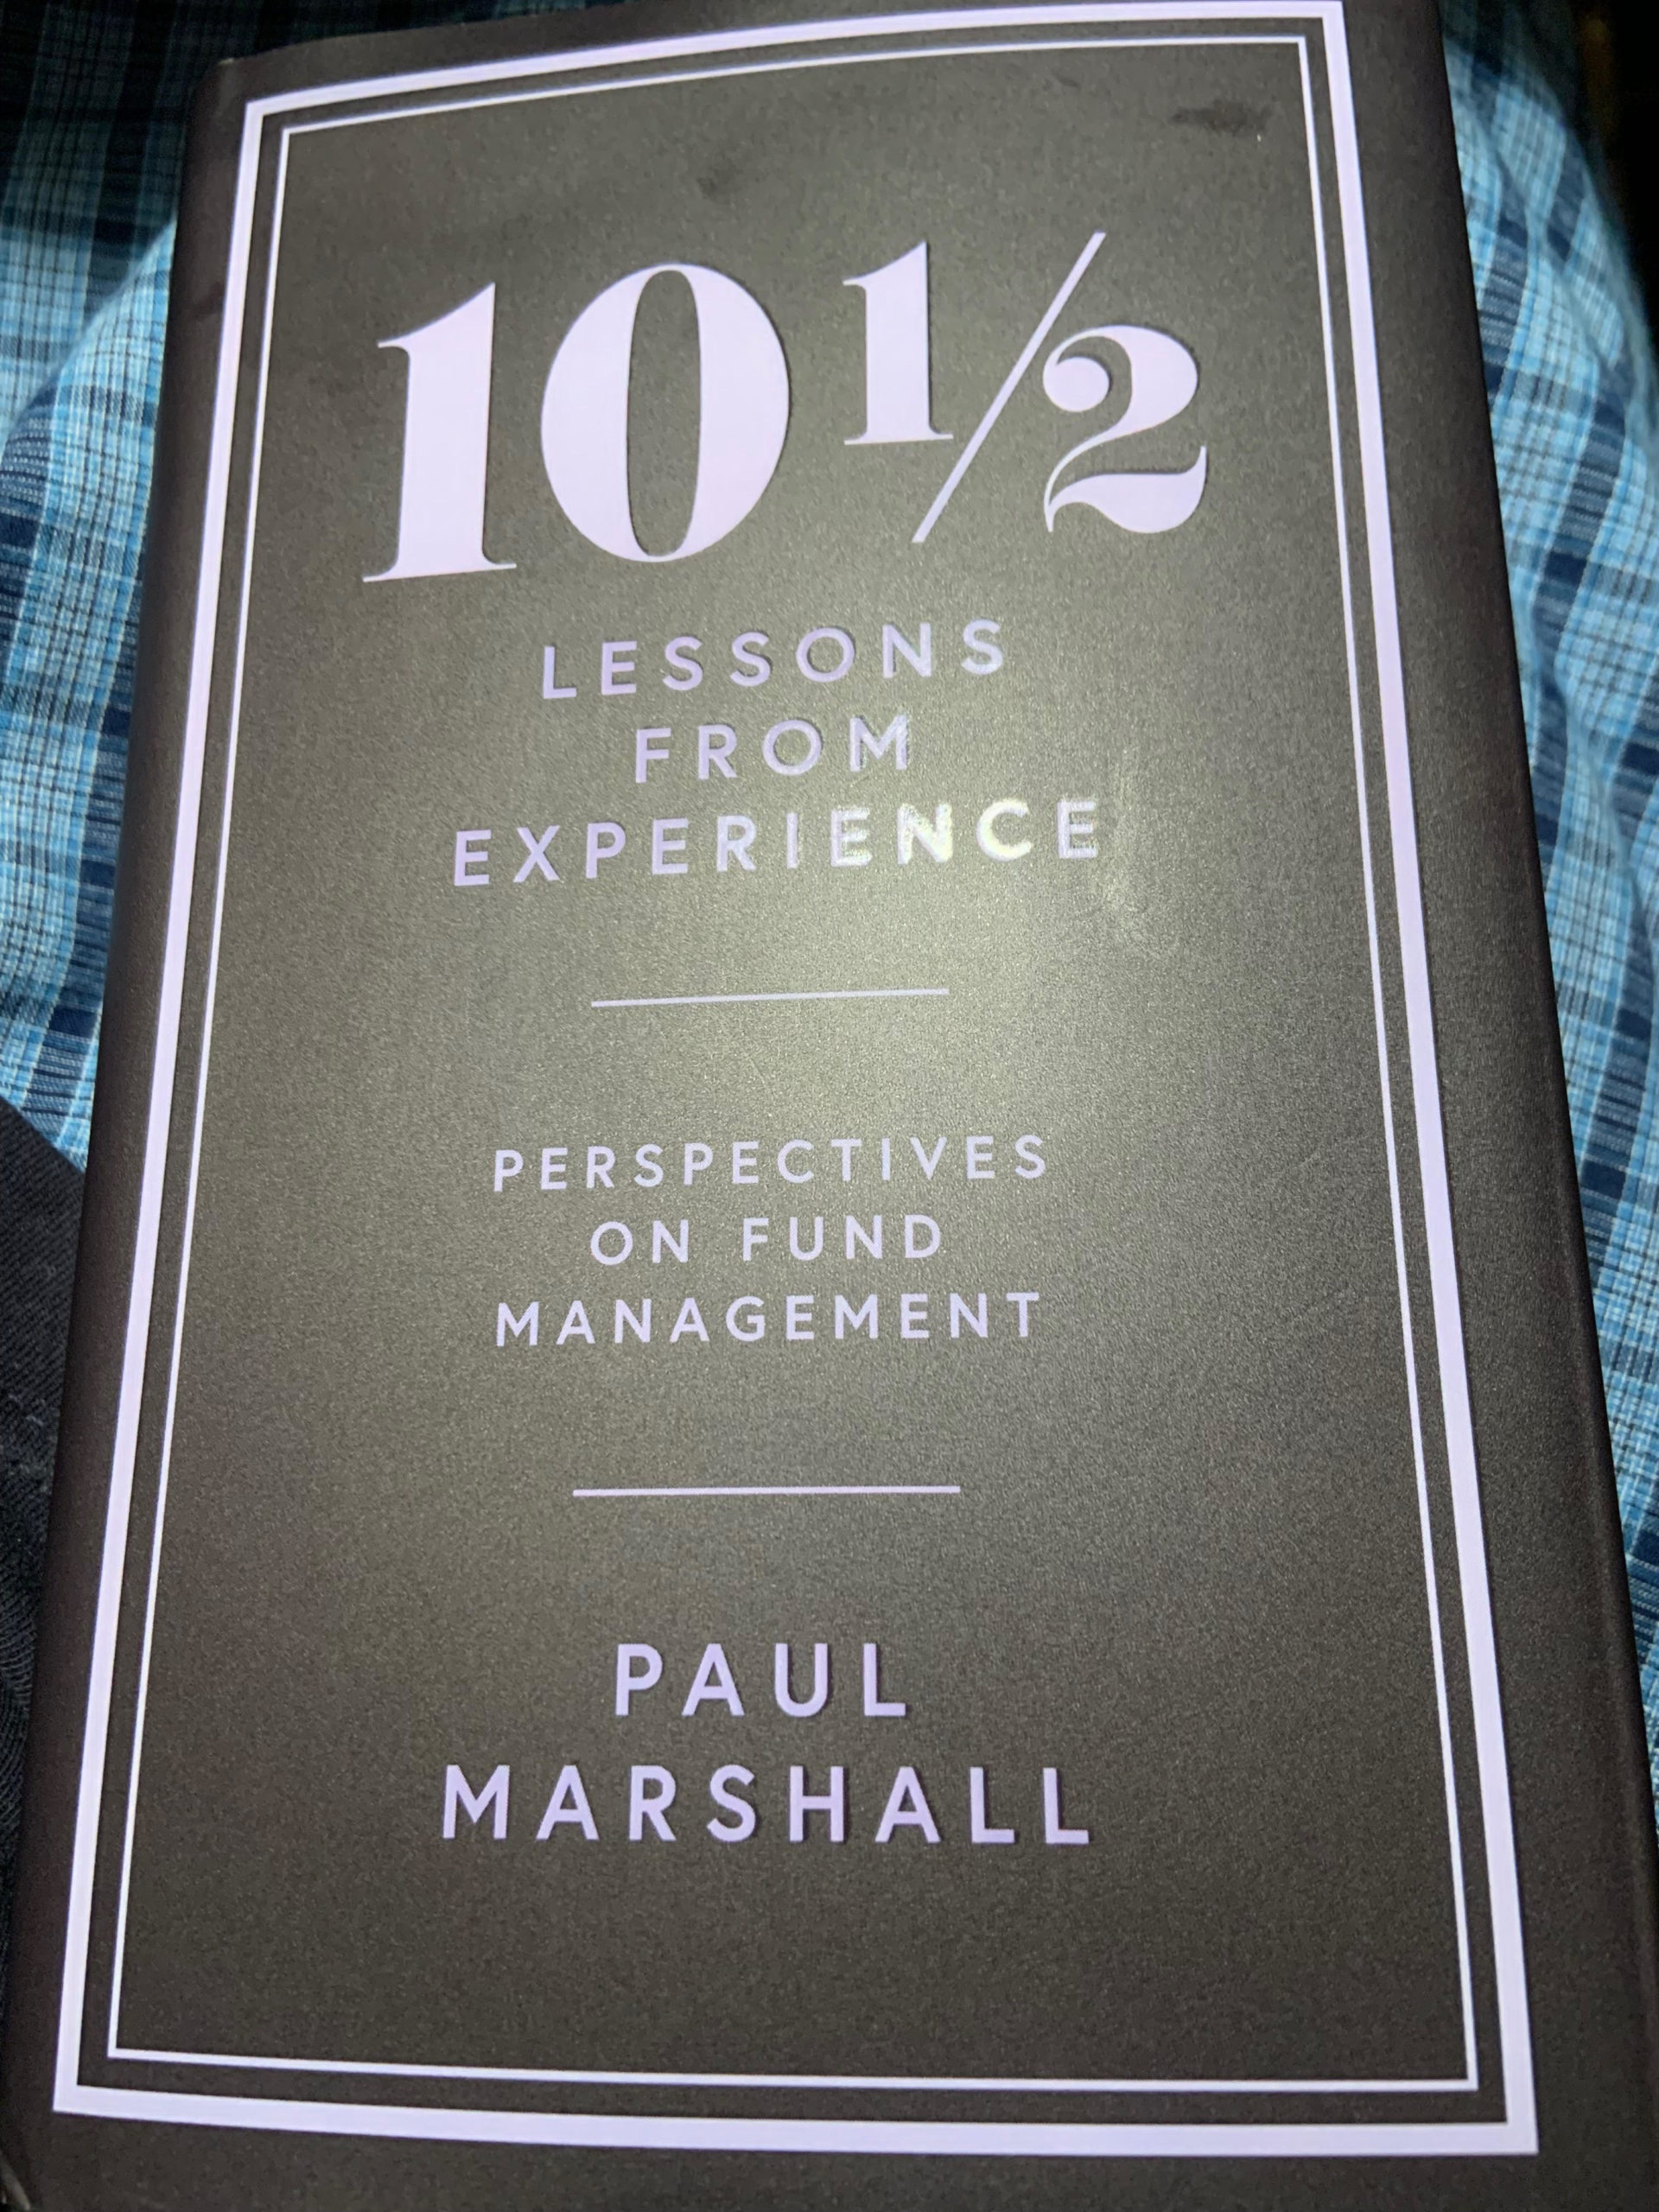
Second, shorting is riskier than being long. London based hedge fund manager Paul Marshall gives the best reason why this is so in Lesson 7 of his little gem of a book 10 1/2 Lessons From Experience: Perspectives on Fund Management (2020) “Shorts Are Different From Longs”:
When a short position goes against you it grows in size and becomes more of a problem for your portfolio. On the other hand, when a long goes against you it becomes smaller and therefore less of a problem. The natural discipline on the long side if a position goes against you and your conviction is unchanged is to add to the position. This does not work on the short side. If a position goes against you it grows and becomes a bigger position automatically (pgs. 74-5)
That’s why you must exercise much tighter risk management when going short than going long: bad timing on a short position, even if you’re right about the fundamentals, can cause your losing shorts to balloon in size. If you don’t cover before the problem becomes unmanageable, that’s a recipe for blowing up your account.
In conclusion, while shorting is generally a bad strategy, the current massive disconnect between price and fundamentals may have created “The Shorting Opportunity of a Lifetime”. Nevertheless, shorting is riskier than going long and so you must exercise tighter risk management and be willing to admit that your timing was wrong, even if your conviction about the fundamentals remains unchanged, much quicker than when going long.
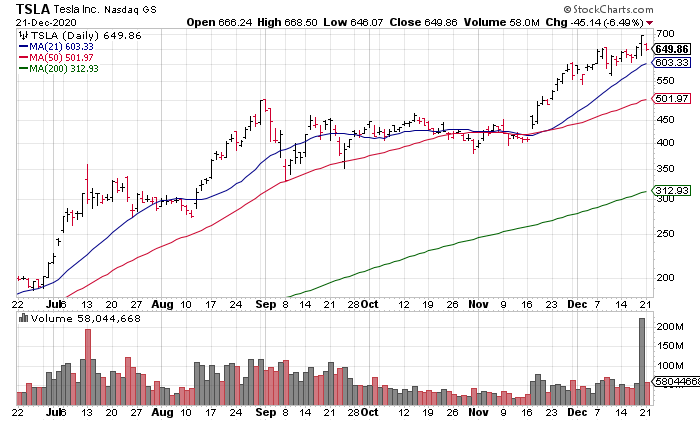
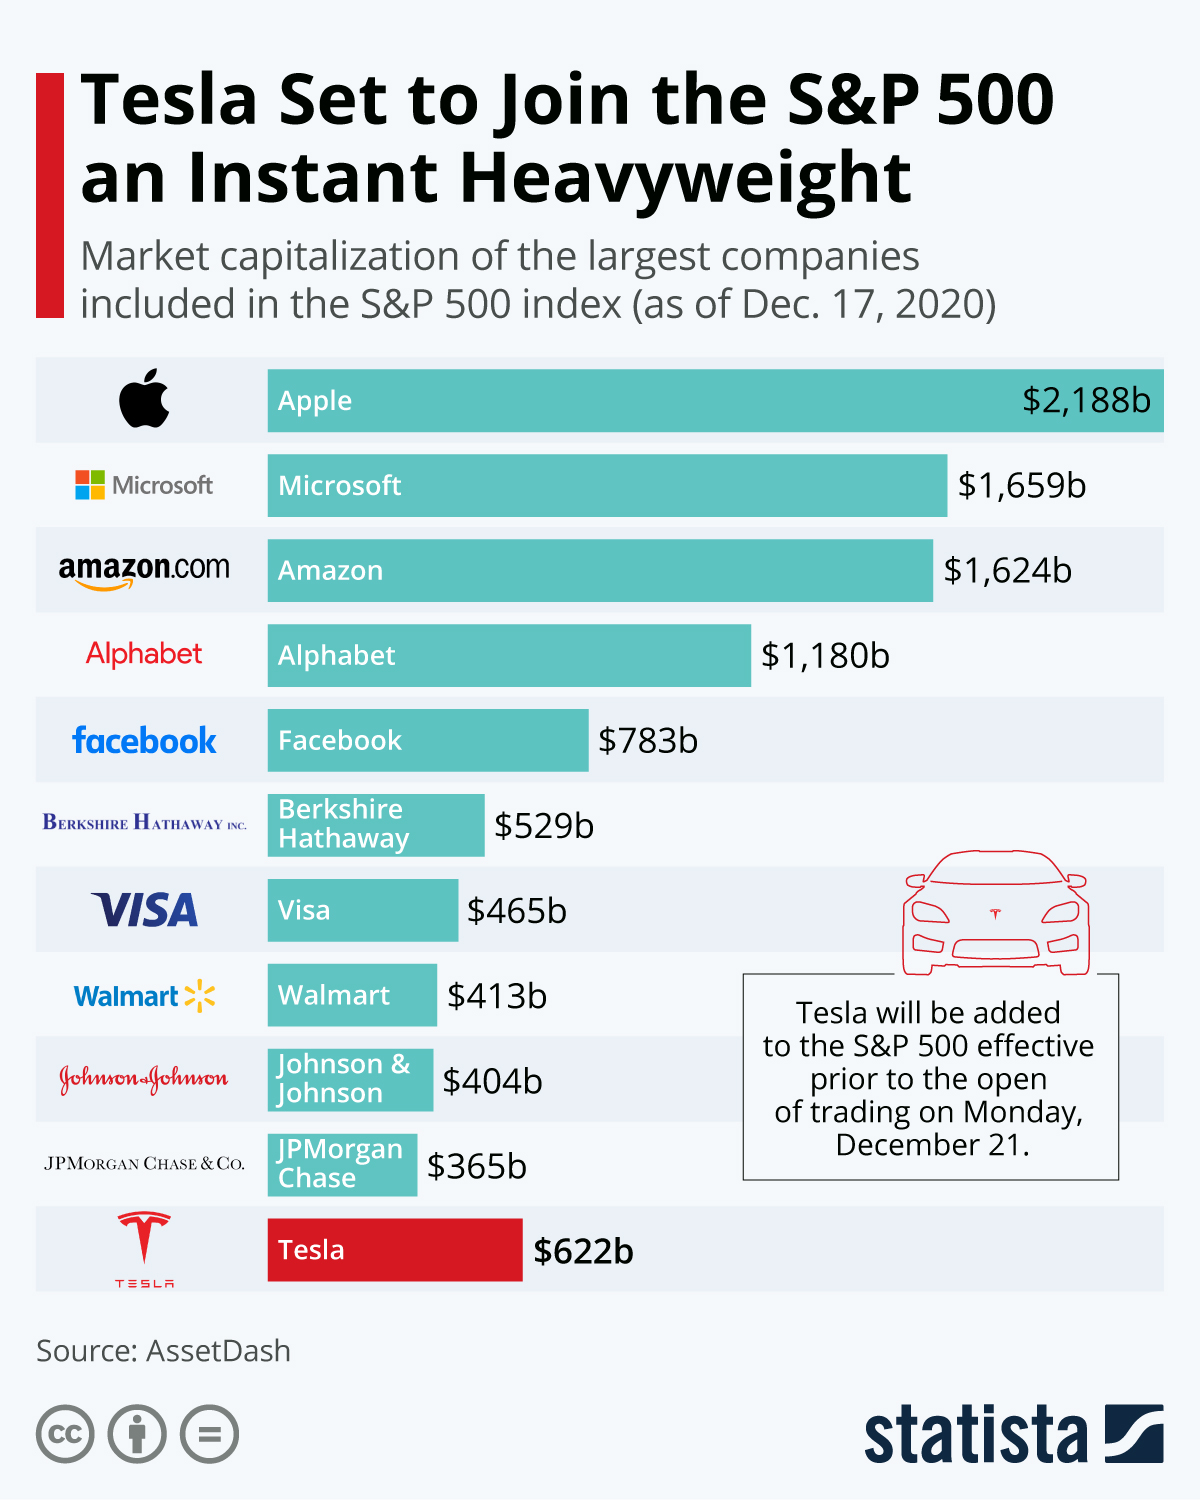
If we’re going to talk about the insanity of this market and shorting, we’re going to have to talk about Tesla (TSLA), THE bubble stock of the the bubble. TSLA is up more than 200% in the last 7 months and just joined the S&P 500 yesterday as the 6th largest US company (2nd Chart Source: Sentimentrader Blog, “A rally so broad, even the weak are strong”, December 21, 2020).
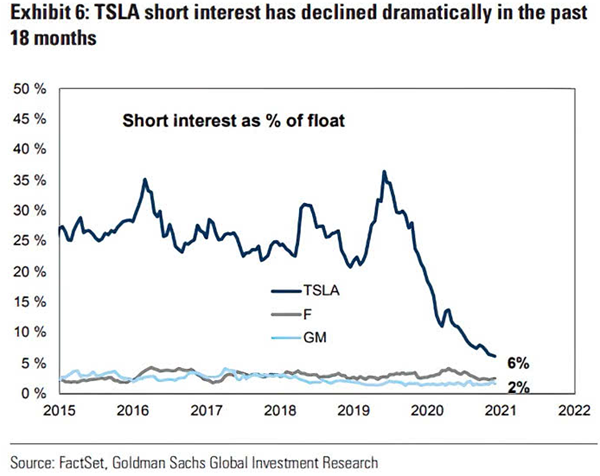
Despite the stock being insanely disconnected from its fundamentals (more on this in a minute), short sellers have been burned time and again by TSLA and have thrown in the towel (Chart Source: Sentimentrader Blog, “A rally so broad, even the weak are strong”, December 21, 2020).
Make no mistake about it: TSLA stock price is completely disconnected from its fundamentals. TSLA closed Monday at $649.86 but has only earned $1.84 Non-GAAP in the last 12 months. To make matters worse, more than half of that (94 cents) comes from selling Automotive Regulatory Credits to other automakers, not from selling cars from which they’ve made only 90 cents.
It’s crazy to me that a number of highly respected veteran investment professionals have long term price targets in the $1000s for TSLA when current fundamentals don’t even justify a price in the $100s. For example, see Cathie Wood, Gary Black and Ron Baron. Last night, my Mom said that many of her friends are long TSLA and she wishes she had bought some too. Well, who wouldn’t want a 200+ percent return in 7 months? The problem is that this isn’t investing, it’s gambling. It’s Tulip Mania 2020.
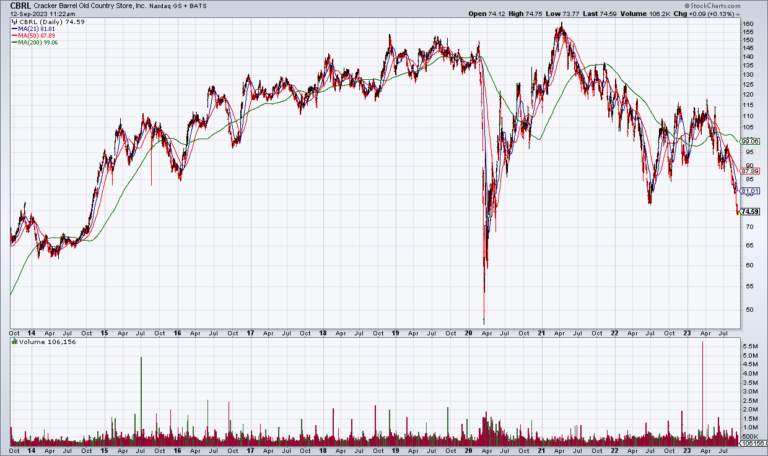
While TSLA is the bubble stock du jour, almost every other stock is in bubble territory as well. In recent morning blogs, I’ve discussed NKE, DRI and DIS, but it’s to the point that you could throw a dart at the stock price tables in the WSJ and, whichever stock you hit, it’s almost certain that it’s in a bubble as well.
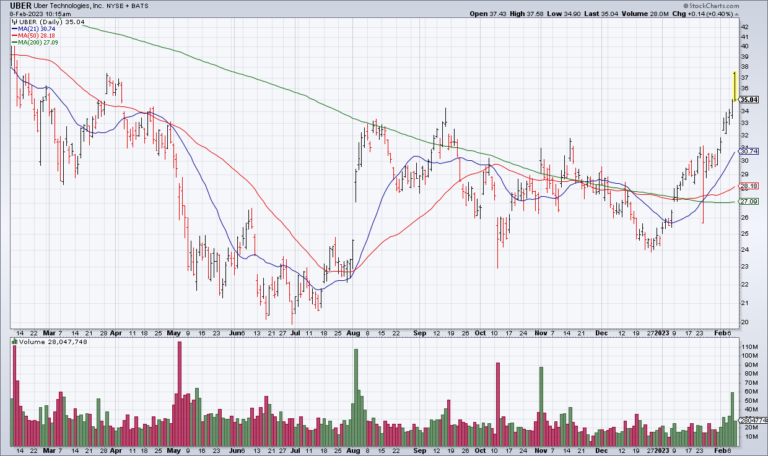
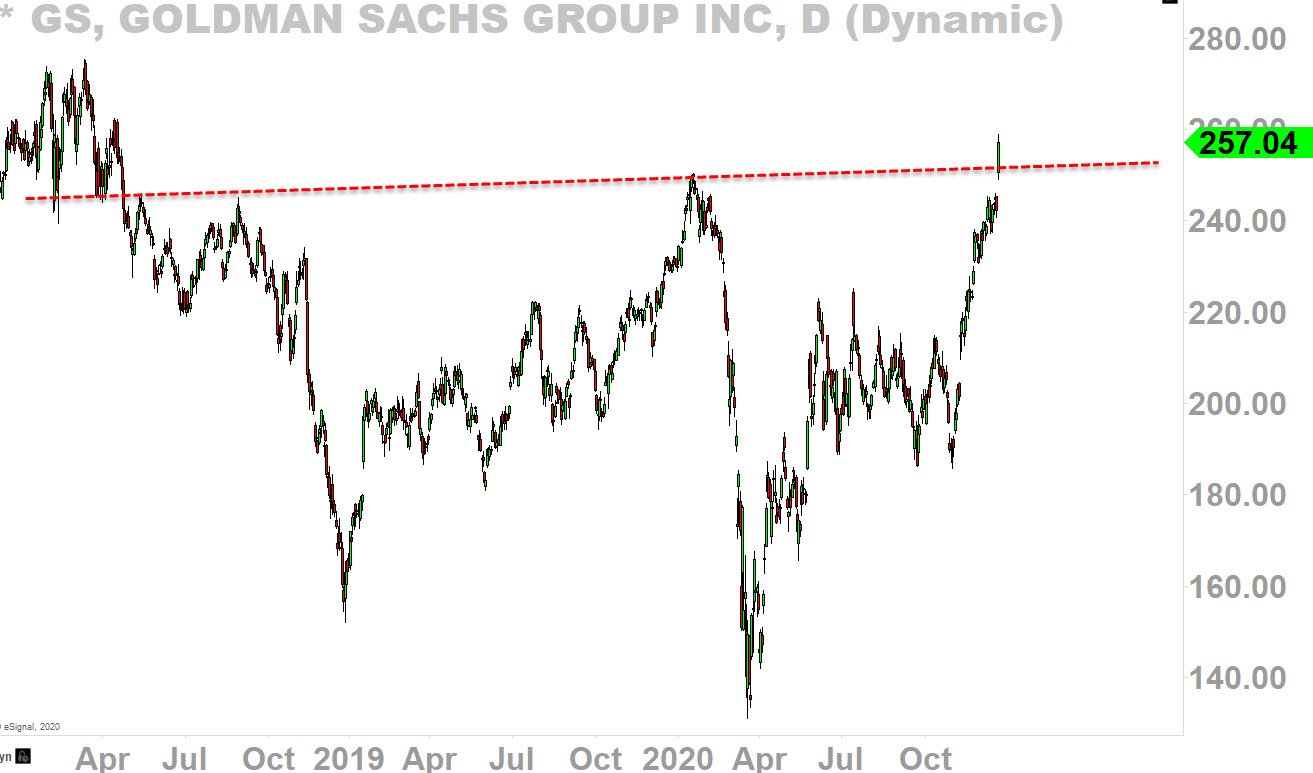
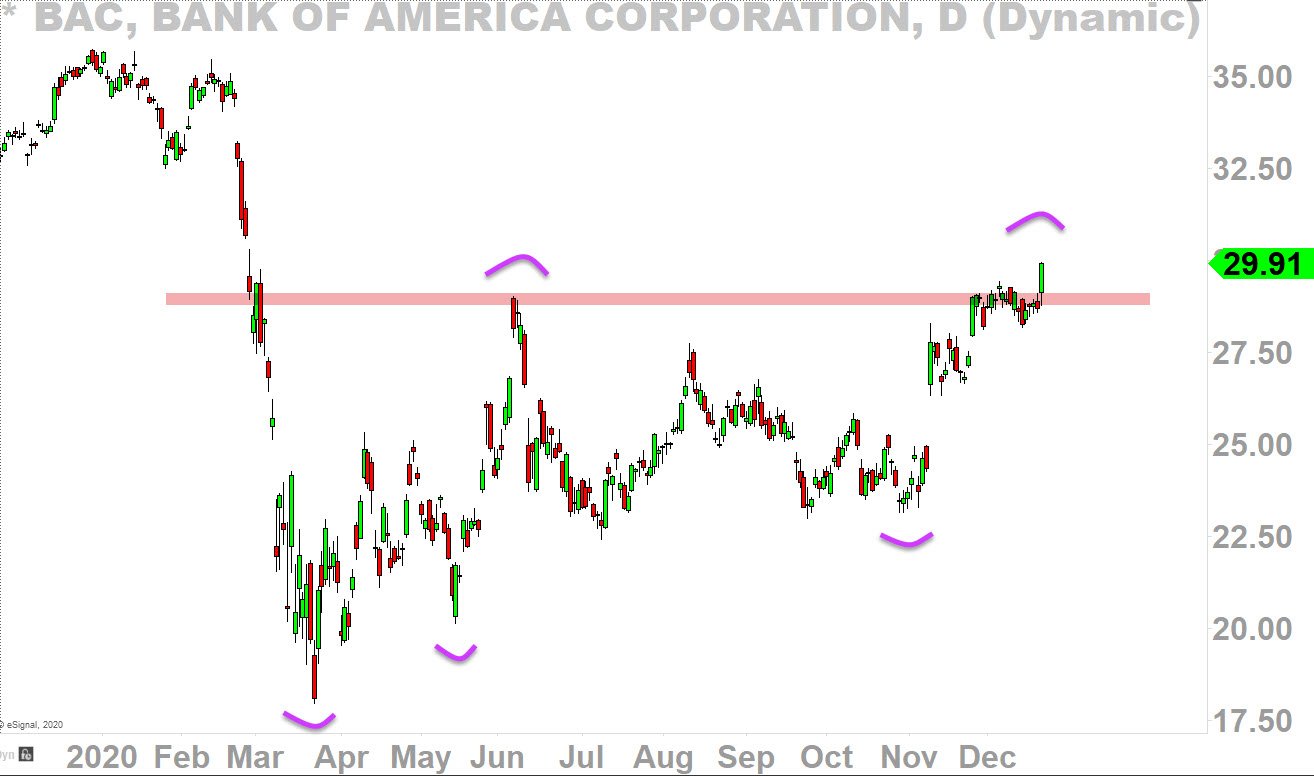
In this context, let’s take a look at some charts from @2kaykim on some financial stocks – the group was strong yesterday – that were breaking out yesterday.

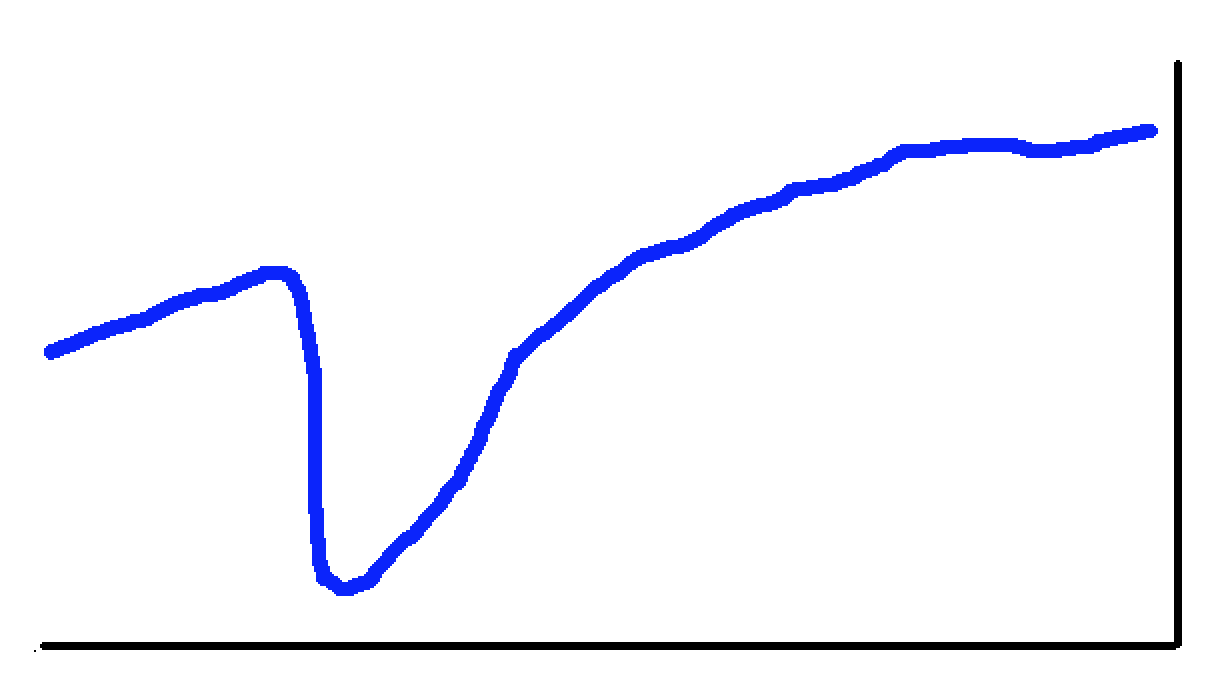
Let’s wrap up with a funny tweet by Katherine Greifeld of Bloomberg who tweeted yesterday: I love how every year-to-date chart is just like
There’s a lot in this morning’s blog so let’s sum up:
1 – It’s a bubble but we don’t know exactly when it will end because market timing is an art not a science
2 – Shorting is generally a losing strategy but, like 1929 and 2000, this may be an exception
3 – TSLA is the bubble stock du jour
4 – Even long underperforming financial stocks are now breaking out