Market Commentary, KR DOCU & ULTA Earnings, The $ Is Breaking Down
Note: To sign up to be alerted when the morning email is posted to my website, enter your name and email in the box in the right hand corner titled “New Post Announcements”. That will add you to my AWeber list. Each email from AWeber has a link at the bottom to “Unsubscribe” making it easy to do so should you no longer wish to receive the emails.
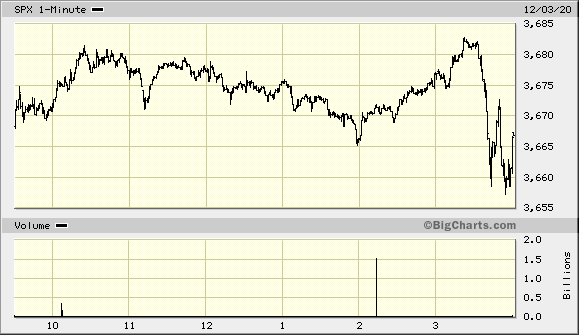
Today (Thursday) was a little more interesting than Wednesday, with a nasty last half hour selloff, but the end result was the same: little change in price on low volume. The major indexes performed as follows: S&P -0.06% NASDAQ +0.23% Russell +0.58%. Like Wednesday, volume in the main ETFs that track these indexes (SPY, QQQ and IWM) was anemic. No reason Friday should be any different.
However, there were a number of notable earnings reports today (Thursday)
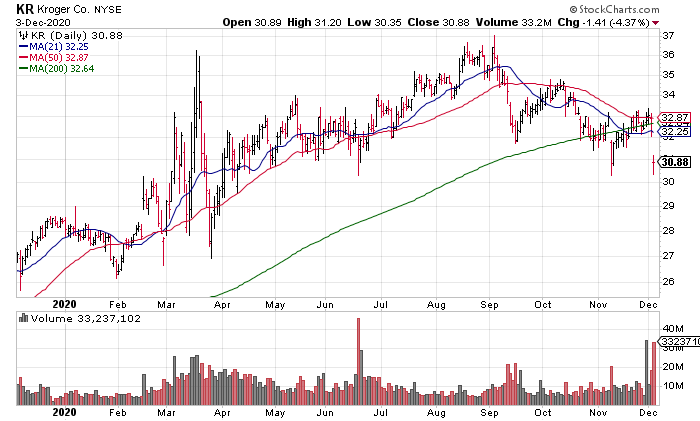
The country’s largest supermarket chain, Kroger (KR, $24 billion market cap), reported before the open. Top Gun is long shares of KR and the numbers looked fine to me with comps +10.9% and Adjusted EPS +51% to 71 cents. However, shares finished the day -4.37% on 3x average volume as investors are concerned about the implications for their business of a reopening.
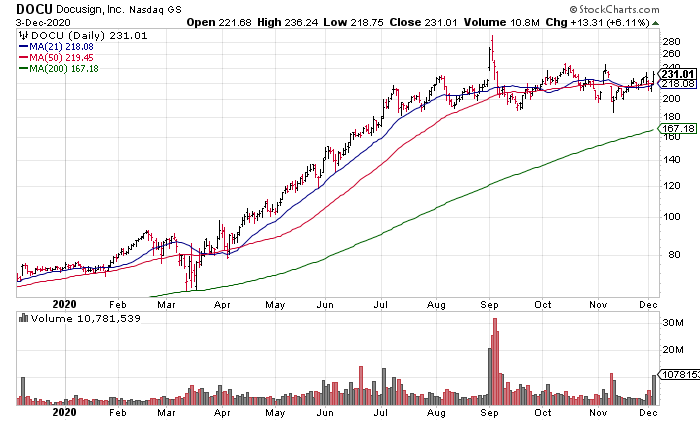
In the afternoon, Docusign (DOCU, $48 billion market cap) and Ulta Beauty (ULTA, $16 billion market cap) reported. DOCU reported Revenue +53% to $383 million and 22 cents Adjusted EPS. The problem here, as with so much Tech, is extreme valuation. DOCU guided full year revenue to $1.426 billion to $1.430 billion. That means shares are trading at 33x current year revenue: 33x earnings is expensive; I don’t know what to say about 33x revenue!
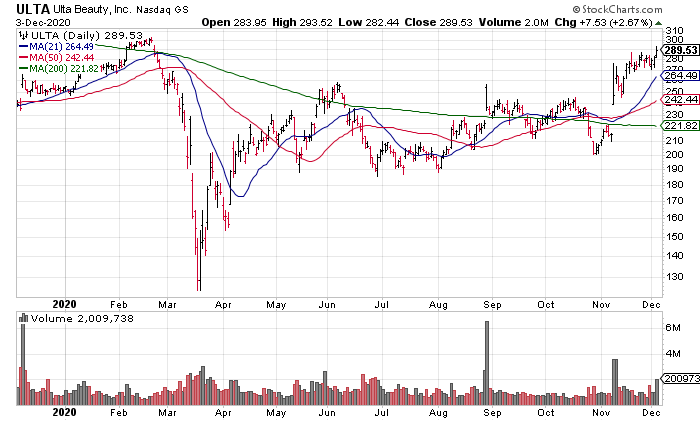
ULTA reported an underwhelming quarter with comps -8.9% and Adjusted EPS -26% to $1.64. I have no idea why shares were trading near all-time highs heading into the report but last time I checked the after hours they were off about 4%.
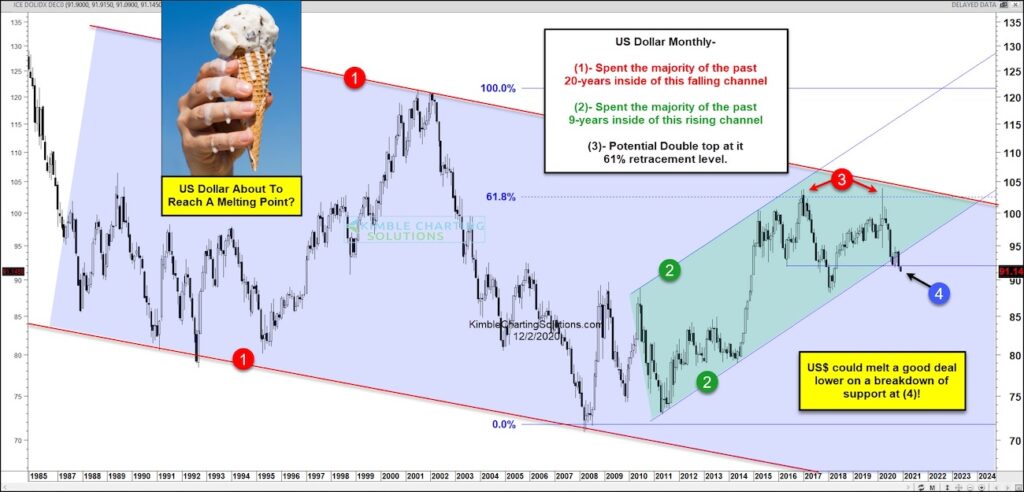
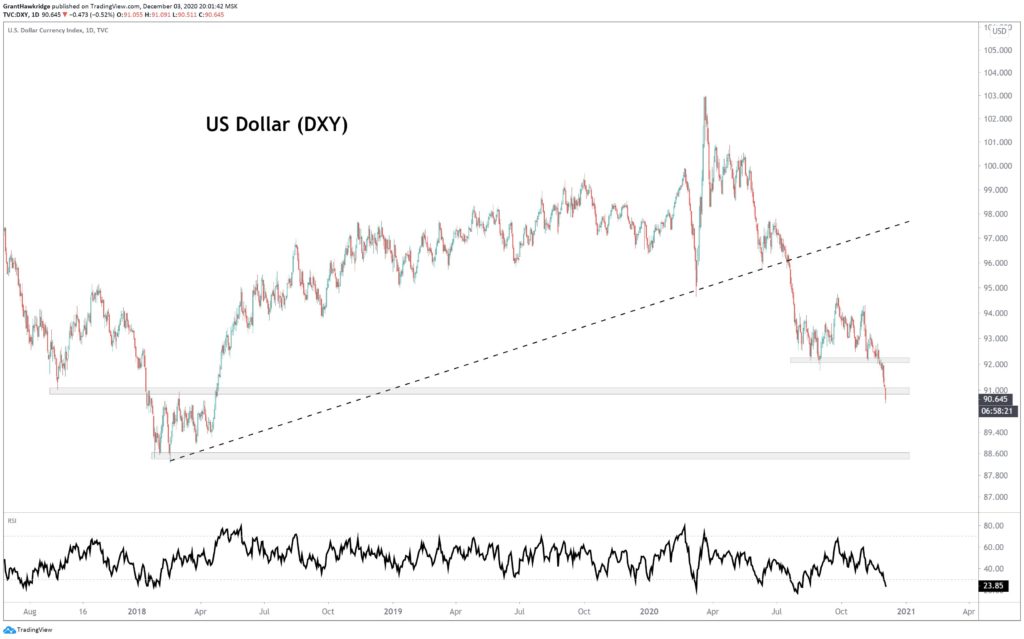
On Wednesday, I talked about “The Economics of the $ Breakdown”. It’s important to understand that so that you know why I, and so many other investors, are following the $ so closely. Here, I simply want to point out that the $ Index has broken down below its 2020 support at 92 and now appears headed to the 2018 lows ~88.5 (Chart Source: Grant Hawkridge Tweet, 12/3, 9:05am PST).
Chris Kimble stepped back and looked at a monthly chart of the $ going back to 1985. If 88.5 doesn’t hold, I don’t see much support all the way back down to the all-time lows ~72 from 2008. If this happens, expect the magnitude of the three consequences I wrote about in “The Economics of the $ Breakdown” to be extreme. The first two – rising interest rates and real economy inflation – would likely wreck and destabilize our highly indebted, import dependent economy.
