NOTE: Every week or two I write a Client Note for my clients. For a limited time, I am allowing non-clients to sign up and receive it at the same time as my clients. You can sign up at the top right hand corner of the website. I will also be posting the notes on my blog with a time delay from time to time.
Originally sent to clients Saturday, January 31.
*****
The technical question now posed by a chart of the S&P 500 is:
Was the nasty selloff in August and September the beginning of a bear market or a correction in an ongoing bull market?
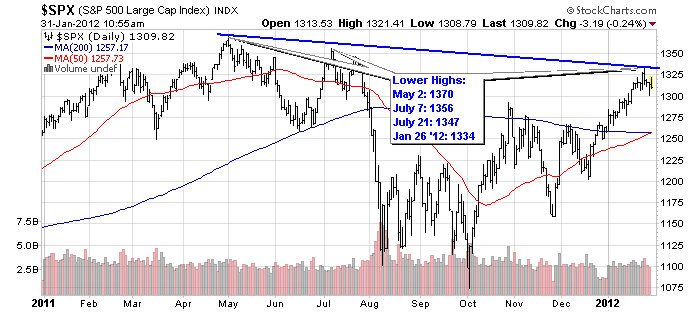
My bias is the former while the majority subscribe to the latter. Technically, to confirm a continuing bull market we need to be making new highs which we have not done yet. As you can see in the attached chart, the intraday high of the current rally is 1334 made last Wednesday (Jan 25). That is still lower than the bull market high (May 2 ’11: 1370) and the highs from last July (July 7 ’11: 1356, July 21 ’11: 1347).
Since Wednesday, there has been a mild correction which is perfectly natural after such a strong move. However, after a bit of rest and consolidation, we will have to make new highs to confirm a bull market. If not, this could be the end of a sucker’s rally that will catch almost everybody leaning the wrong way and be followed by a nasty reversal.
One reason for my suspicion is the low quality of the rally.
Last week I pointed out that it is being led by sectors like financials and homebuilders.
In addition, the move from December 20th through January 25th which took us from 1205 to the recent highs has been on light news flow and low volume. NYSE Composite Volume during that period averaged 3.5 billion shares compared to 4.3 billion shares for the rest of the comparable part of 2011 – an 18% decrease.
On the bullish side of the ledger, many are pointing to a Golden Cross that will take place at today’s close. This is when the 50 Day Moving Average crosses above the 200 Day Moving Average and is supposed to signal a bullish trend. Combining this bullish indicator with the lower highs mentioned earlier creates a lot of tension on the charts which should be resolved in the next month or two.
Propelling the current rally to new highs last week were two important pieces of bullish news. The first was a blowout quarter from the preeminent stock – and company – in the market today: Apple (AAPL). It is not going too far to say that this company is changing the world. Their products have that intangible “must have it” quality and people across the world are buying them in unheard of quantities.
The second was a dovish surprise from The Fed which promised to keep interest rates “exceptionally low” for at least another 3 years (“at least through late 2014” –
FOMC Statement, January 25).
As news circulates that Facebook plans to file for an IPO tomorrow, I continue to suggest that you unfriend the market.
THE BOLDEST OFFER IN INVESTMENT MANAGEMENT HISTORY:
Starting now I will guarantee at least the return of the S&P 500 in 2012 after fees to the first $1 million in new investor money.* That is, for those investors, I will make up out of my own pocket any deficit between the performance of your account after fees and the performance of the S&P 500 this year. I will sign a contract with you to this effect. You will thereby be guaranteed at least the return of the S&P 500 and any upside to it will be yours as well.
Greg Feirman
Founder & CEO
A Registered Investment Advisor
9700 Village Center Dr. #50H
Granite Bay, CA 95746
(916) 224-0113
CALL NOW (916-224-0113) TO TAKE ADVANTAGE OF THIS
INCREDIBLE OFFER!

