Analyzing Tuesday & Previewing Wednesday, Russell Performance After +95% After 52 Week Low, Fund Manager Cash Hits 4% (BofA), Mega Caps Lagging
Note: To sign up to be alerted when the morning email is posted to my website, enter your name and email in the box in the right hand corner titled “New Post Announcements”. That will add you to my AWeber list. Each email from AWeber has a link at the bottom to “Unsubscribe” making it easy to do so should you no longer wish to receive the emails.
Tuesday was a big day for the US stock market with the S&P +1.29%, NASDAQ +1.25% and Russell +2.4%. In addition, breadth was great with 405 advancers to 95 decliners on the S&P 500 (Source: BeSpoke Twitter, Tuesday December 15, 1:07pm PST). The S&P 400 Midcap Index was even stronger with 373 advancers to 27 decliners and the S&P 600 Smallcap Index similar with 556 advancers to 44 decliners (Source: BeSpoke Twitter, Tuesday December 15, 1:12pm PST).
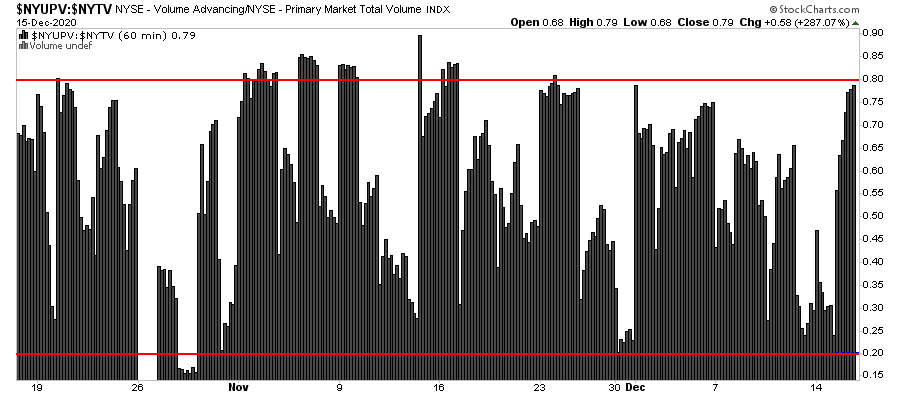
On top of strong breadth, it was a Trend Up Day with the market getting stronger by the hour. Ian McMillan (@the_chart_life) had a great chart showing Advancers to Decliners on the NYSE by hour which shows the market getting increasingly strong as the day went on.
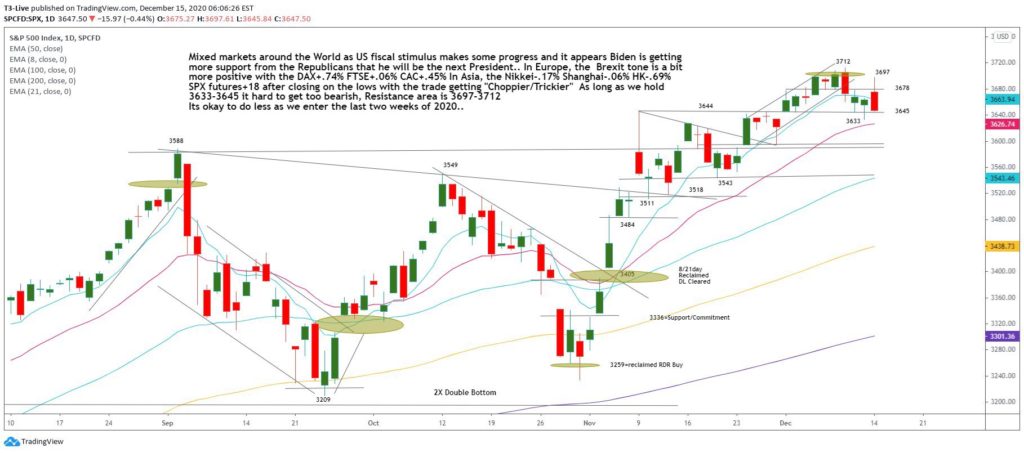
It’s early but let’s do a quick preview of today’s (Wednesday) trading. Europe is up 1-2% an hour and a half into trading and the US Futures have bounced from essentially breakeven to marginally up as a result. Having closed yesterday at 3,695, we will likely be testing the Resistance Zone between 3,697 and 3,712 labeled by day trading wizard Scott Redler yesterday (Tuesday) before the open.
Even prior to the yesterday’s strength, the market was massively overbought, especially the Russell. I led yesterday’s morning blog with Arthur Hill’s chart showing the IWM more than 30% above its 200 DMA. Obviously, after yesterday’s +2.4% move, it is even more technically extended.
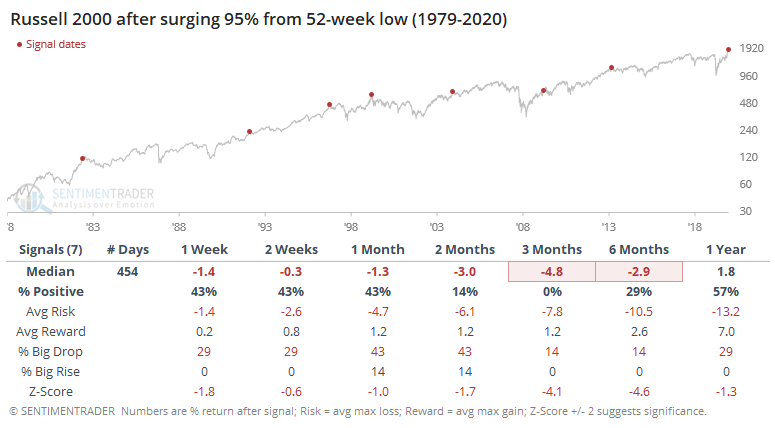
In fact, the Russell is now up more than 95% from a 52 week low for only the 8th time since 1979. However, it has been negative all 7 previous times 3 months later with a median decline of 4.8% (Source: Sentiment Trader, “In record time, small stocks almost double”, December 15).
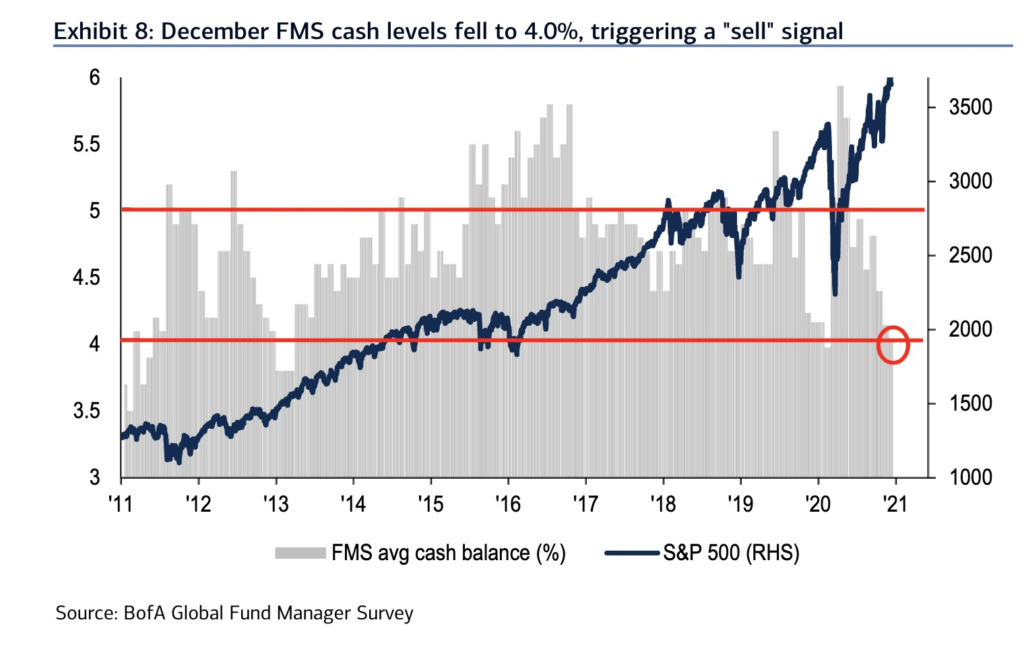
Sell the vaccine 1Q21 – Michael Hartnett, Chief Investment Strategist, B of A (quoted in Jeff Cox, “B of A says sell stocks on the vaccine as overconfident investors dump cash for equities”, CNBC.com, December 15)
Hartnett said that because cash levels in B of A’s monthly Fund Manager Survey fell to 4% triggering a sell signal as the typical S&P return for the next month is -3.2% when cash levels fall that low.
In sum, while yesterday was quite strong and we are looking at testing the ATHs in the S&P today, the data suggests to me that selling at least some into strength is the correct move.
One concern for the market is the lagging performance of the mega caps. JC Parets of All Star Charts did a nice job illustrating this in two charts from a blog post yesterday (Source: JC Parets, “Decision Time for Mega-Caps”, December 15).
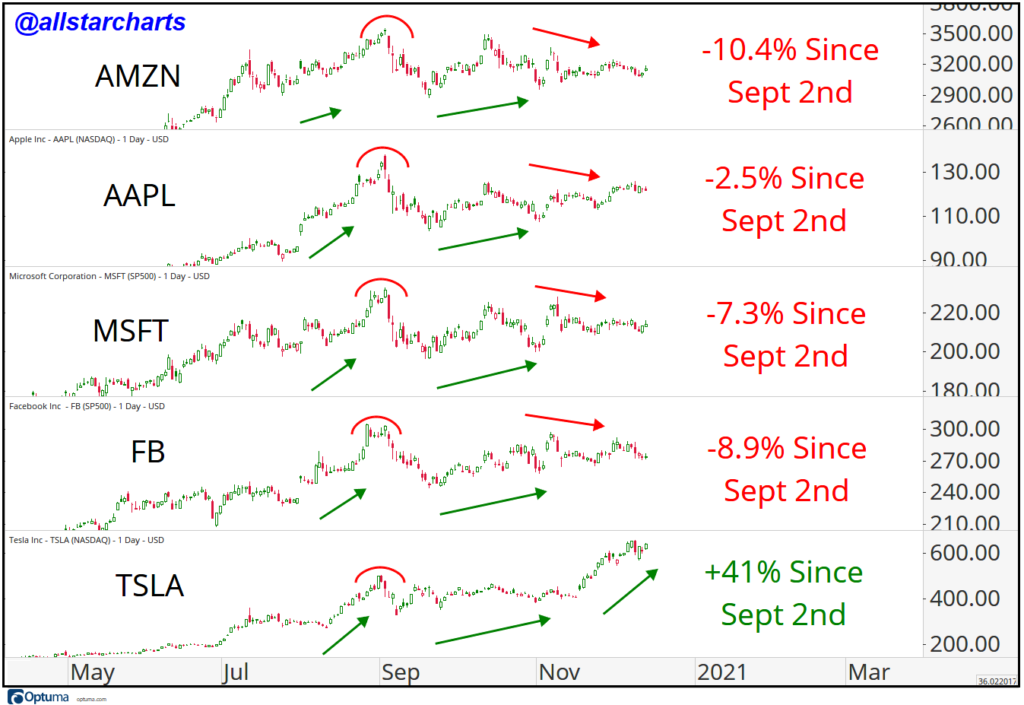
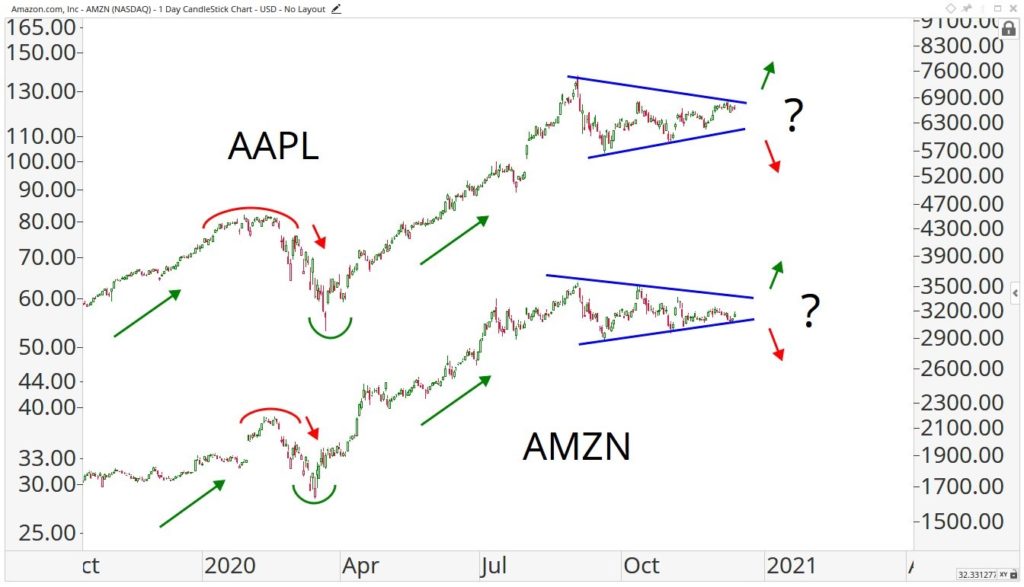
With market caps of $2.2 and $1.6 trillion, respectively, AAPL and AMZN are the most important stocks in the market, followed by MSFT ($1.6 trillion), GOOG/GOOGL ($1.2 trillion) and FB ($800 billion). Just AAPL and AMZN alone make up about 10% of the S&P and 20% of the NASDAQ according to The Chart Report (Source: The Chart Report, Tuesday December 15). With both stocks coiling below their September 2nd highs, which way they break (as well as MSFT and FB) will have significant implications for overall market direction.
To sum up, let’s see if the S&P can break out of its 3,697-3,712 resistance zone today and into new ATH territory. Even if it does, with the market this extended, based on Arthur Hill’s chart from yesterday’s morning blog, data from Sentiment Trader about 3 month forward returns when the Russell goes up 95% or more from a 52 week low and B of A’s sell signal based on declining fund manager cash levels, this looks a like a time to sell into strength to me. Lastly, keep an eye on the Mega-Caps for a clue to overall market direction.
