The Biggest Bubble In History: Breakouts, Valuations, Bitcoin, Liquidity
Note: To sign up to be alerted when the morning blog is posted to my website, enter your name and email in the box in the right hand corner titled “New Post Announcements”. That will add you to my AWeber list. Each email from AWeber has a link at the bottom to “Unsubscribe” making it easy to do so should you no longer wish to receive the emails.
Stocks have reached what looks like a permanently high plateau – Economist Irving Fisher, October 1929
Men think in herds; they go mad in herds and only recover their senses slowly and one by one – Charley McKay, Extraordinary Popular Delusions and The Madness of Crowds
2020 represents the complete triumph of liquidity over fundamentals – Matt King, Citigroup, 2021 Outlook
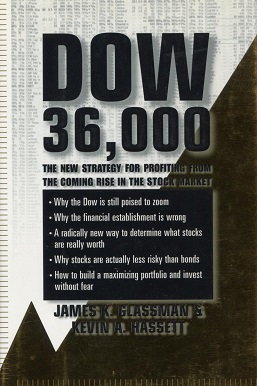
(The preceding photo is of an infamous book published on September 20, 1999, during the raging days of the Dot Com mania, calling for Dow 36,000 when the Dow was currently trading around 11,000).
Despite the meager performance of the indexes yesterday (S&P +0.18% NASDAQ +0.50% Russell -0.36%), a number of important stocks broke out to new highs or from ranges that had been constraining them. Let’s start with Amazon (AMZN, market cap $1.66 trillion) which was up 2.4% on average volume yesterday (Chart Source: Rob Moreno Twitter, Wednesday December 16, 1:24pm).
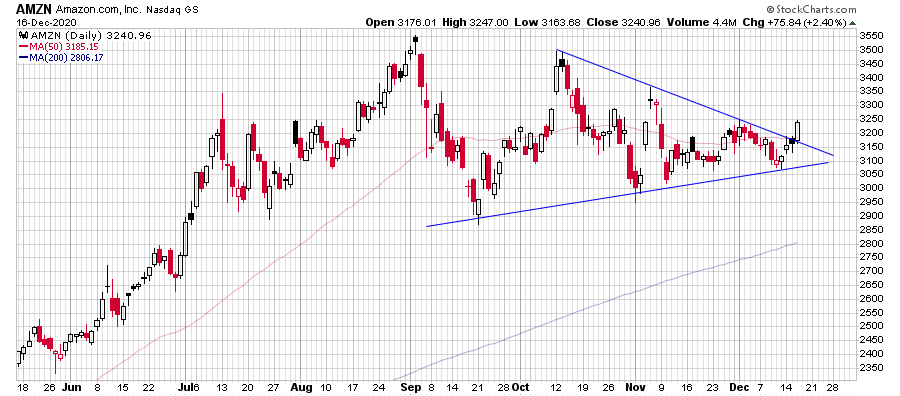
This is obviously a bullish technical development, as we included a chart from JC Parets of All Star Charts yesterday of AMZN coiling and said that which way it broke would have important implications for overall market direction (see Section 4: “Mega Caps Lagging”, Top Gun Financial, Wednesday December 16).
The problem is that the move was not based on any news and only further stretches the stocks gap between price and intrinsic value as AMZN is trading at 95x trailing 12 month EPS of $34.15. I don’t care how good its growth prospects are: 95x is absurd!
Another important stock to break out was Shopify (SHOP, market cap $145 billion), up 7.75% on 2x average volume also on no news (Chart Source: Rob Moreno Twitter, Wednesday December 16, 8:58am).
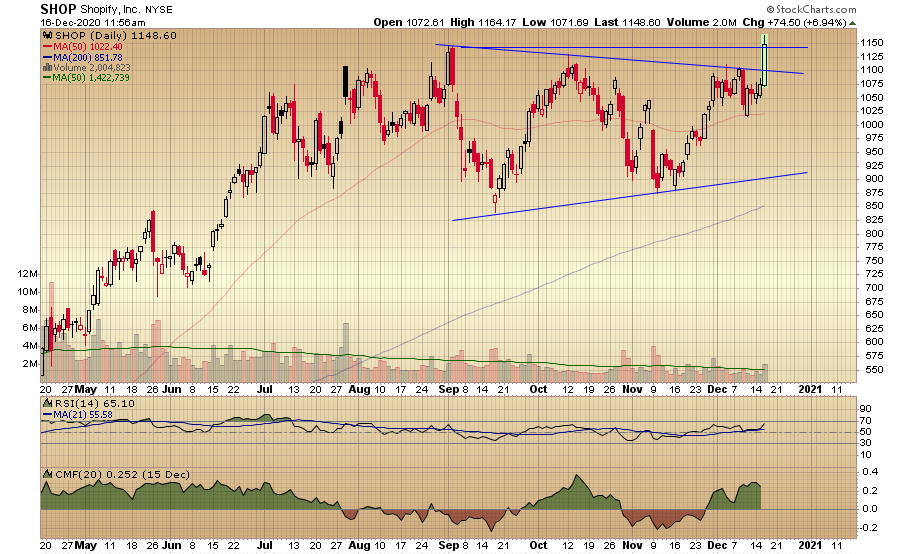
Again, the gap between price and intrinsic value is being stretched beyond absurdity with SHOP trading at 413x trailing 12 month EPS of $2.80. 413x! No comment required.
Chipotle (CMG, market cap $40 billion) also broke out +4.02% on 2x average volume (Chart Source: R. Alfonso Depablos Twitter, Wednesday December 16, 12:55pm).
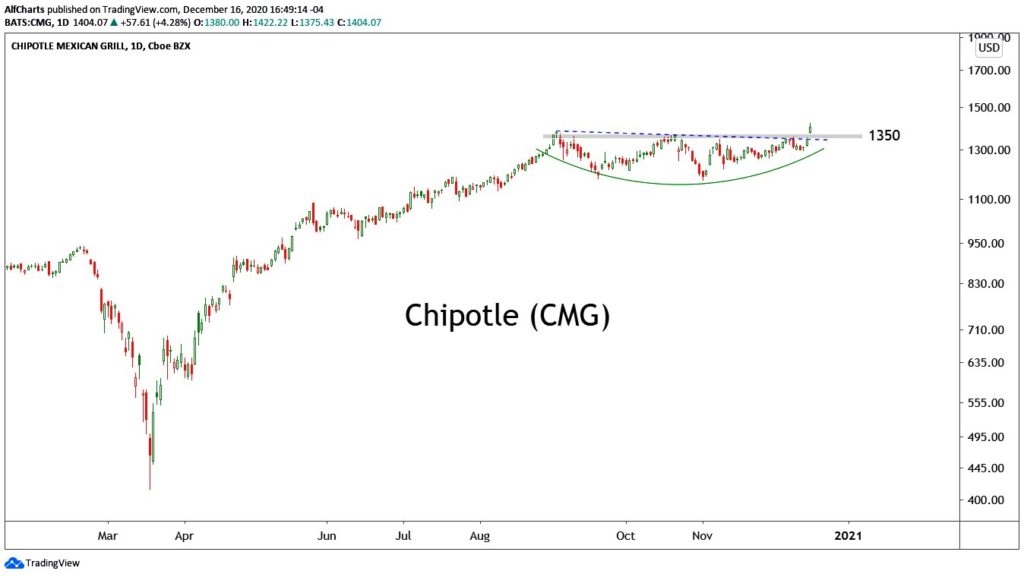
Because CMG was hard hit by the pandemic, let’s use peak 2019 earnings of $14.07 to calculate its 100x P/E. I don’t care how good their burritos are; the stock is not worth 100x earnings!
Finally, let’s talk about Twitter (TWTR, $44 billion market cap) which was +2.29% on 1.5x average volume to new ATHs (Chart Source: 2kaykim Twitter, Wednesday December 16, 10:47am).
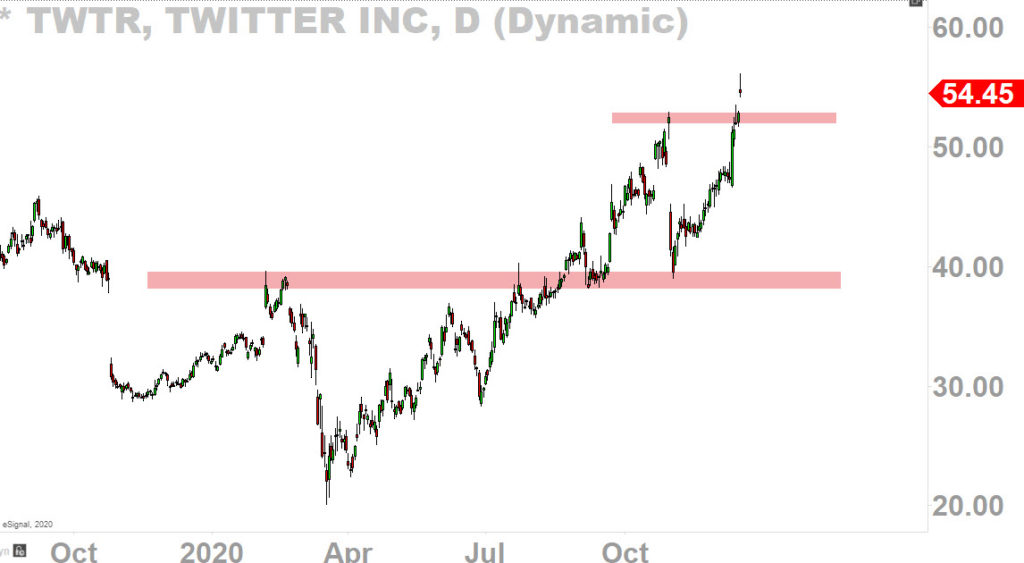
TWTR, also hard hit by the pandemic, is trading at 159x peak 2019 EPS of 34 cents.
I could repeat this exercise ad nauseum (For example, I did Disney (DIS) on Sunday: Section 2: “Case Study In Mania: DIS”, Top Gun Financial, Sunday December 13). I only picked these four stocks because I found nice charts of them by technicians on Twitter.
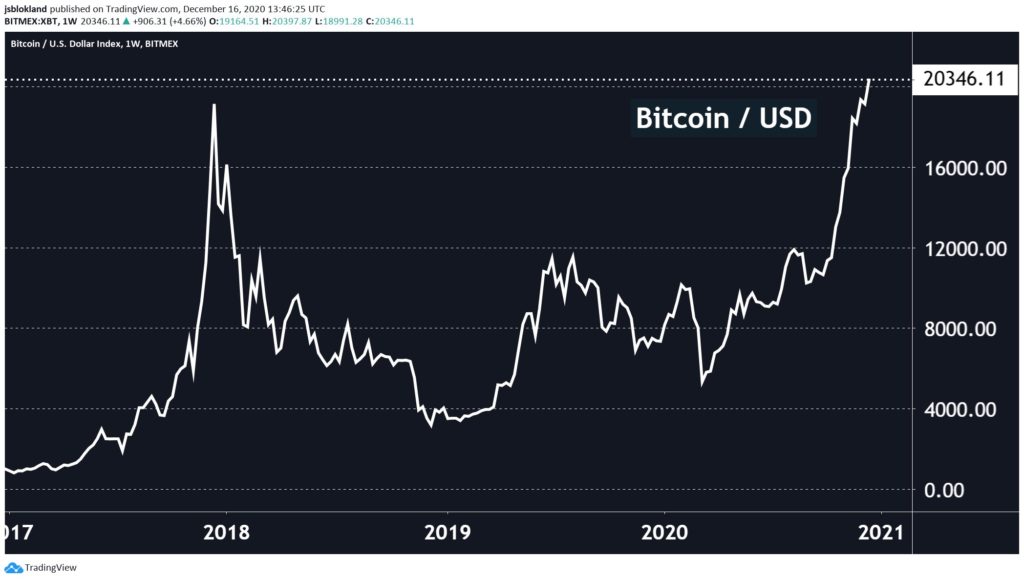
Before leaving yesterday, I must mention Bitcoin’s breakout to new ATHs (it is currently trading just below $23k)(Chart Source: Jeroen Blokland Twitter, Wednesday December 16, 5:47am)
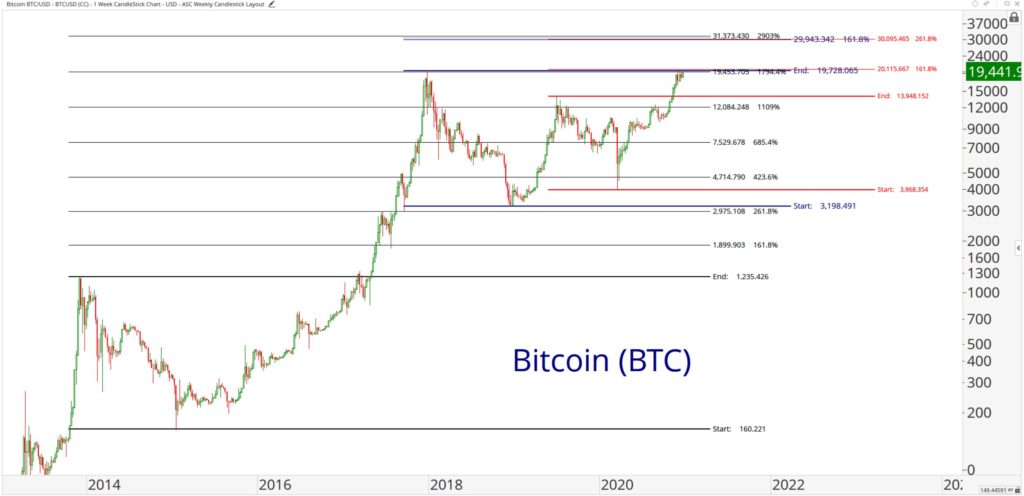
This had All Star Charts Technician Steve Strazza putting a $30k target on Bitcoin based on Fibonacci Extensions (Steve Strazza Twitter, Wednesday December 16, 1:30pm). I’m not saying it’s not going to get there; I’m saying Fibonacci Extensions, like any technical analysis that forecasts future price rather than analyzing price in the present, is bad technical analysis (see “Kids Drawing Lines” (Top Gun Financial, Saturday December 12) for more of my views on Fibonacci Extensions and Measured Move Breakouts, really any technical analysis that goes beyond analyzing price in the present to forecasting it in the future).
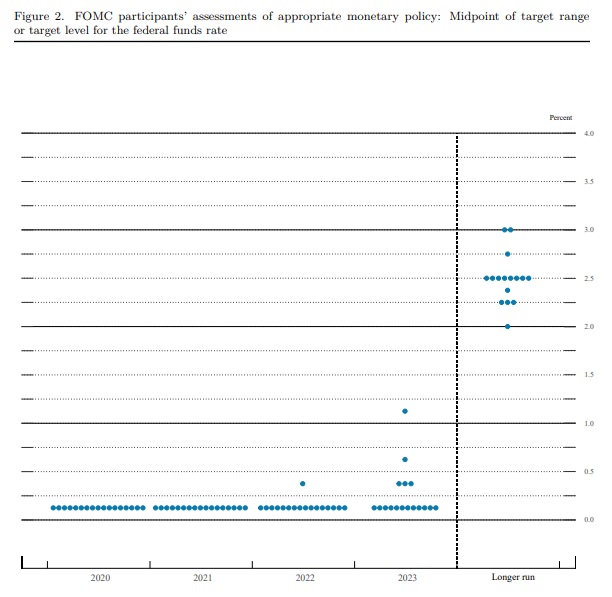
The backdrop to this madness is the extraordinary liquidity environment provided by global central banks which the Fed announced yesterday it will be maintaining by keeping the Fed Funds rate at 0% until at least 2023 and continuing to buy $120 billion of treasuries and agency backed mortgage securities a month (Source: FOMC Statement December 16, 2020).
Take a look at these two charts from Rothko Research and SentimenTrader on liquidity.
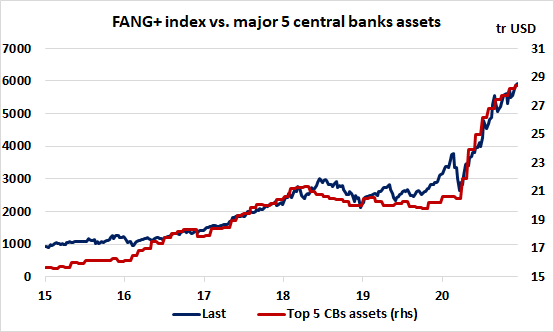
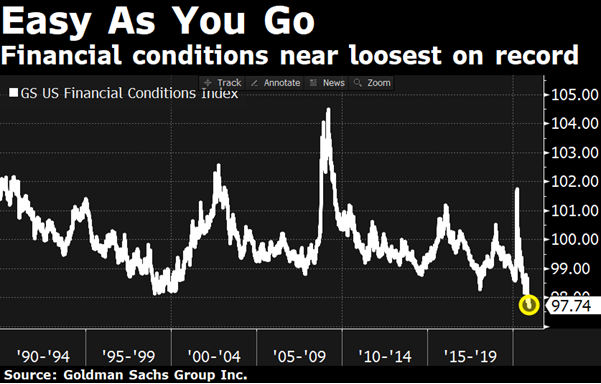
I can’t say it any better than Citigroup’s Matt King: this has nothing to do with fundamentals and everything to do with liquidity.
I’ve said it before: This is the biggest financial bubble in world history – bigger than 2000 and bigger than 1929. When it pops, we will have an economic catastrophe on our hands like nothing so far in American history. Get your popcorn ready.